Data Science, Human Geography, & Environmental Justice Youth Project (DL compatible)

Data Science, Human Geography, & Environmental Justice Youth Project

Inspired by Undesign the Redline PBLs, Rebecca Solnit’s Infinite City, and the intersectionality my students navigated every day, I resolved to honor their distance learning investment by making the ecosystem and data analysis about their new pandemic-era environment. My students wanted to learn how to help, instead of remaining silent and isolated from what science was wrestling with in reality, both in terms of research and outreach. Learning human geography in the context of how to define life during the pandemic and how to design metrics for answering scientifically testable questions was one way they could figure out how to cope with daily catastrophe and grief.

STEP ONE: SURFACE EXISTING KNOWLEDGE & ESTABLISH COMMUNITY CONTEXT.

First I asked students to mark on a blank map of San Francisco where they lived (or where they were willing to report) in relation to the school. Students noticed certain patterns and created questions about it said about the students or the school.


STEP TWO: INVITE SHARING SOMATIC OBSERVATIONS TO IDENTIFY LAYERS OF PATTERNS.

We used a padlet to share the 5 senses we could describe in our own separate neighborhoods across the city, and used that to create a summary of the communities and the questions they presented.

Students developed their own sense of purpose and curiosity when their sense of intersectionality was acknowledged and made explicit through formalized data.

Some possible prompts:

  • What kinds of places do you go to relax or be at peace? Any green spaces? How far away are they?

  • What kinds of people live near you? How would they describe themselves?

  • How do the people around you make a living?

  • What products do you or people around you use? What brand names do you see most often?

  • What medical or health needs do you notice in people around you?

  • What sounds do you hear around you?

  • What smells do you sense?


STEP THREE: IDENTIFY ISSUES.

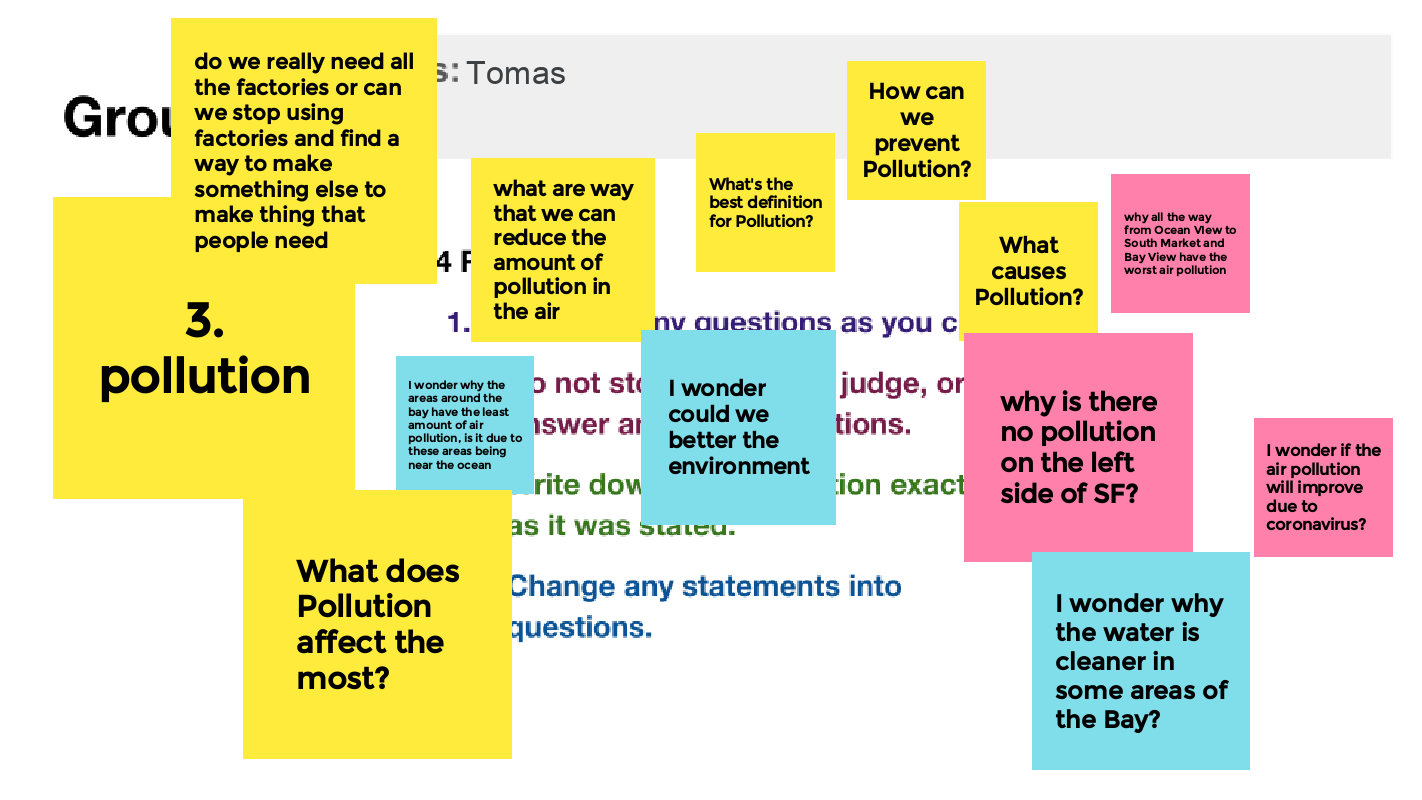
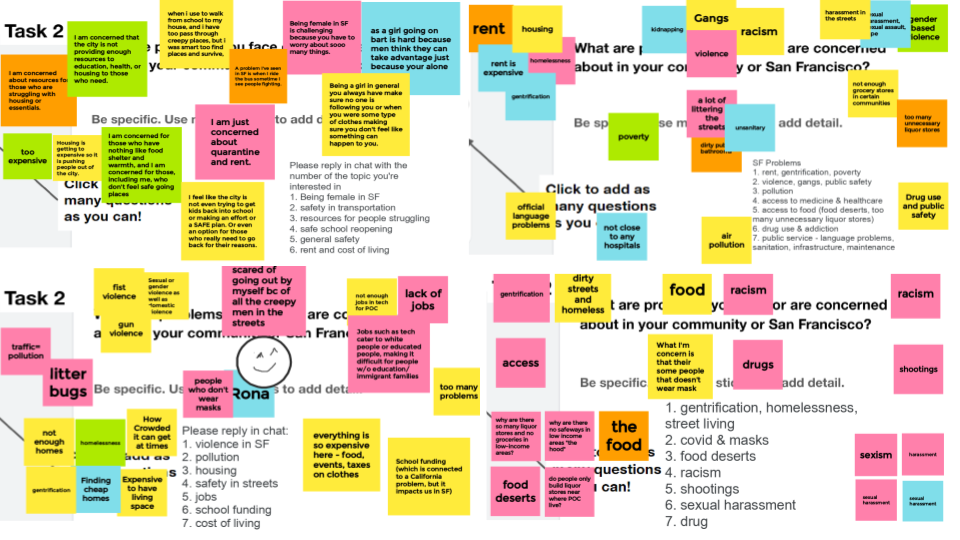
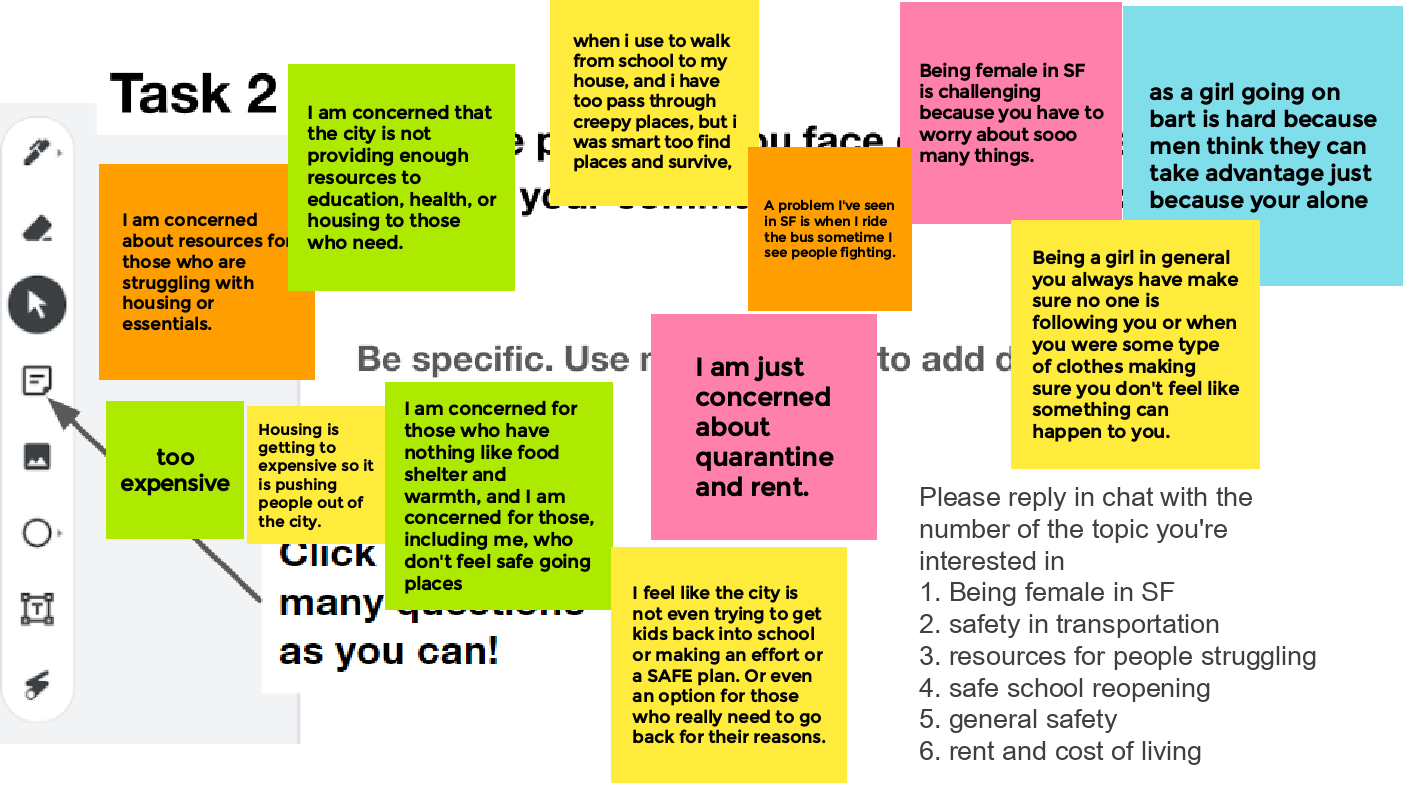
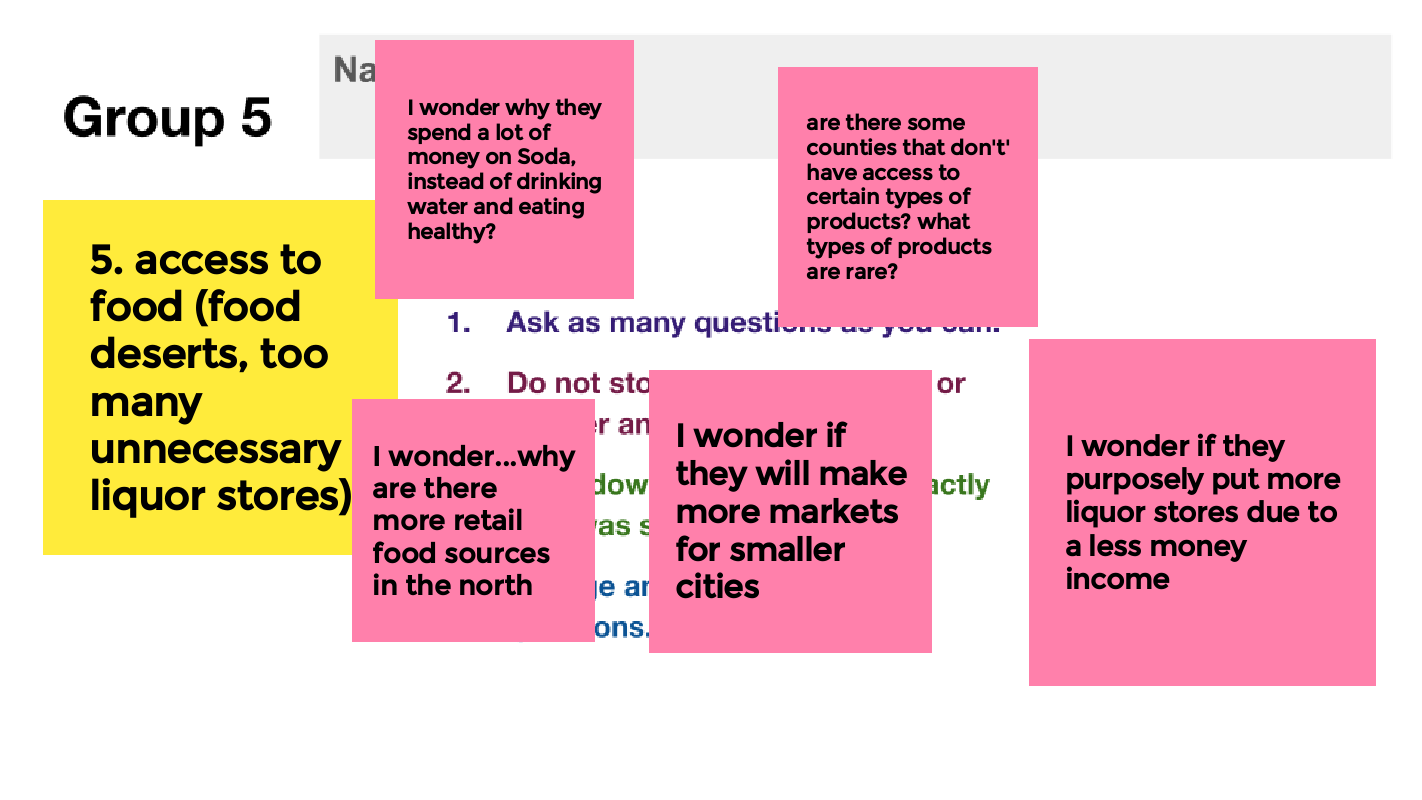
Approach: Question Formulation Technique based on recent headlines. Gathered a Jamboard of recent headlines based on patterns identified in Step 2 and asked students to add questions. Students then discussed further in another Jamboard to talk further about experiences in the city. During physical classroom learning, students used post-it notes and others added to a padlet.

Preview (distance-learning Jamboards)


STEP FOUR: EXPLORE AND ANALYZE DIFFERENT LAYERS AND TYPES OF DATA TO INFORM FOCUS.

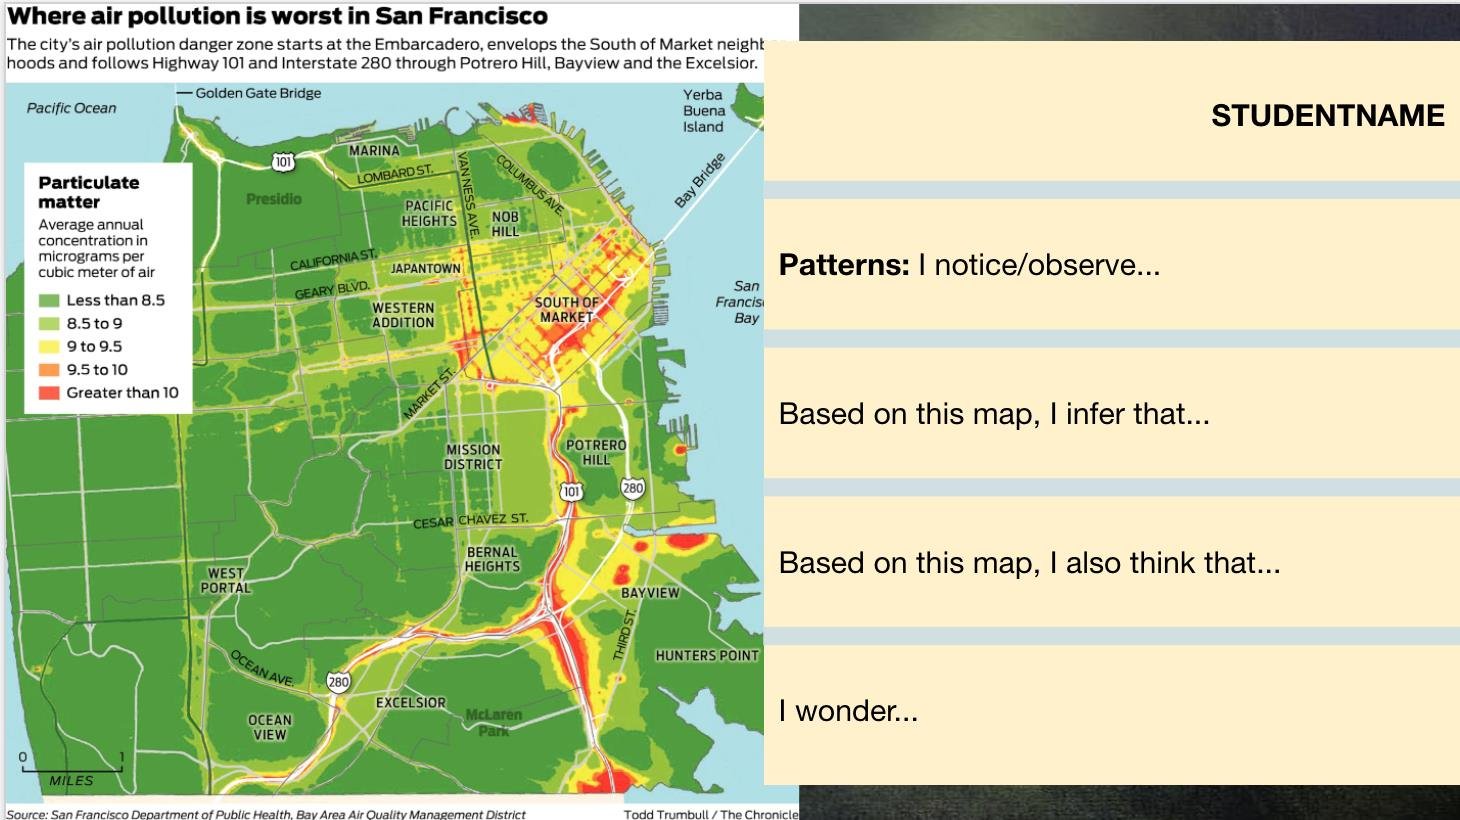
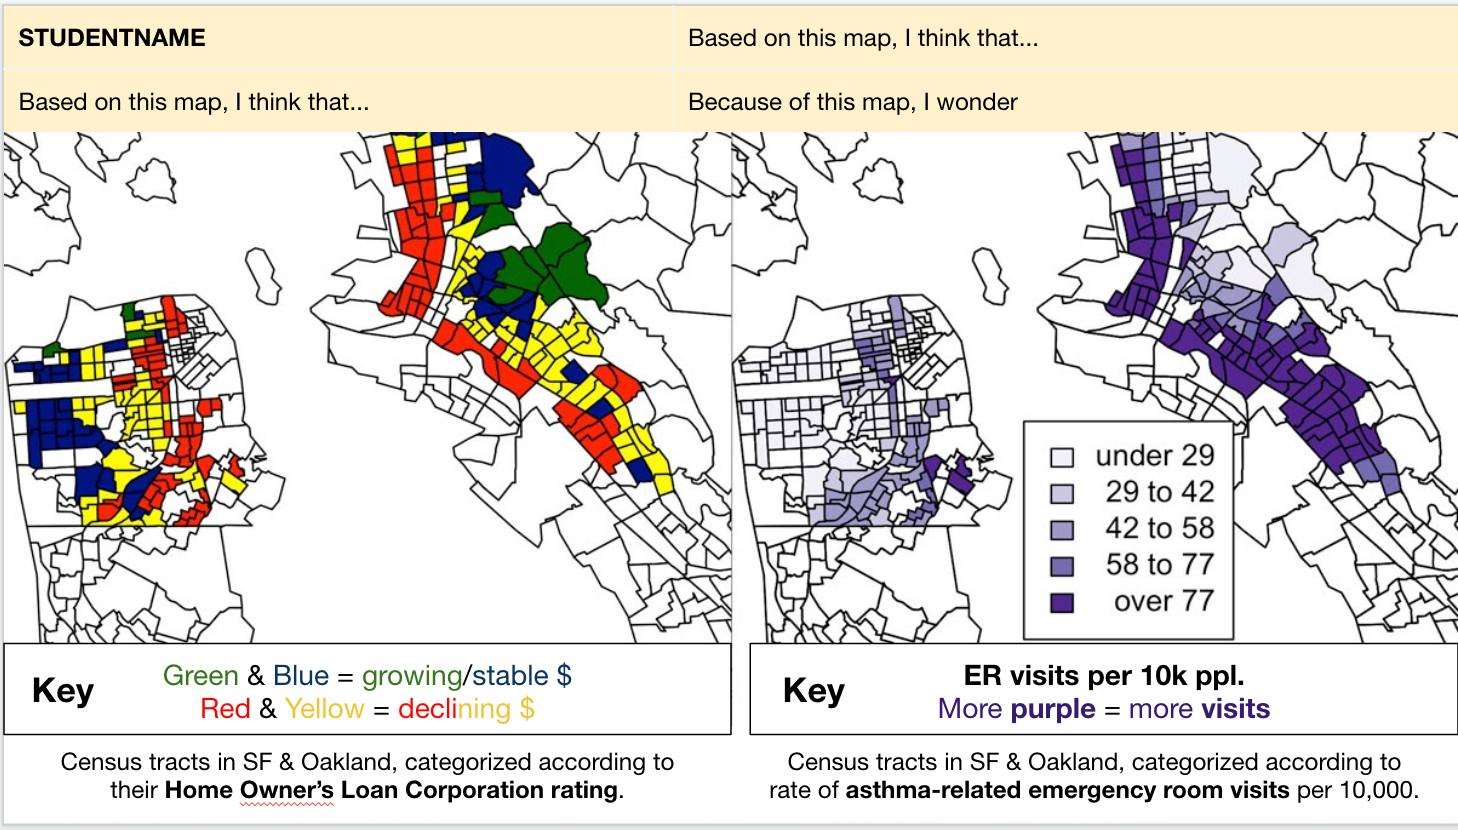
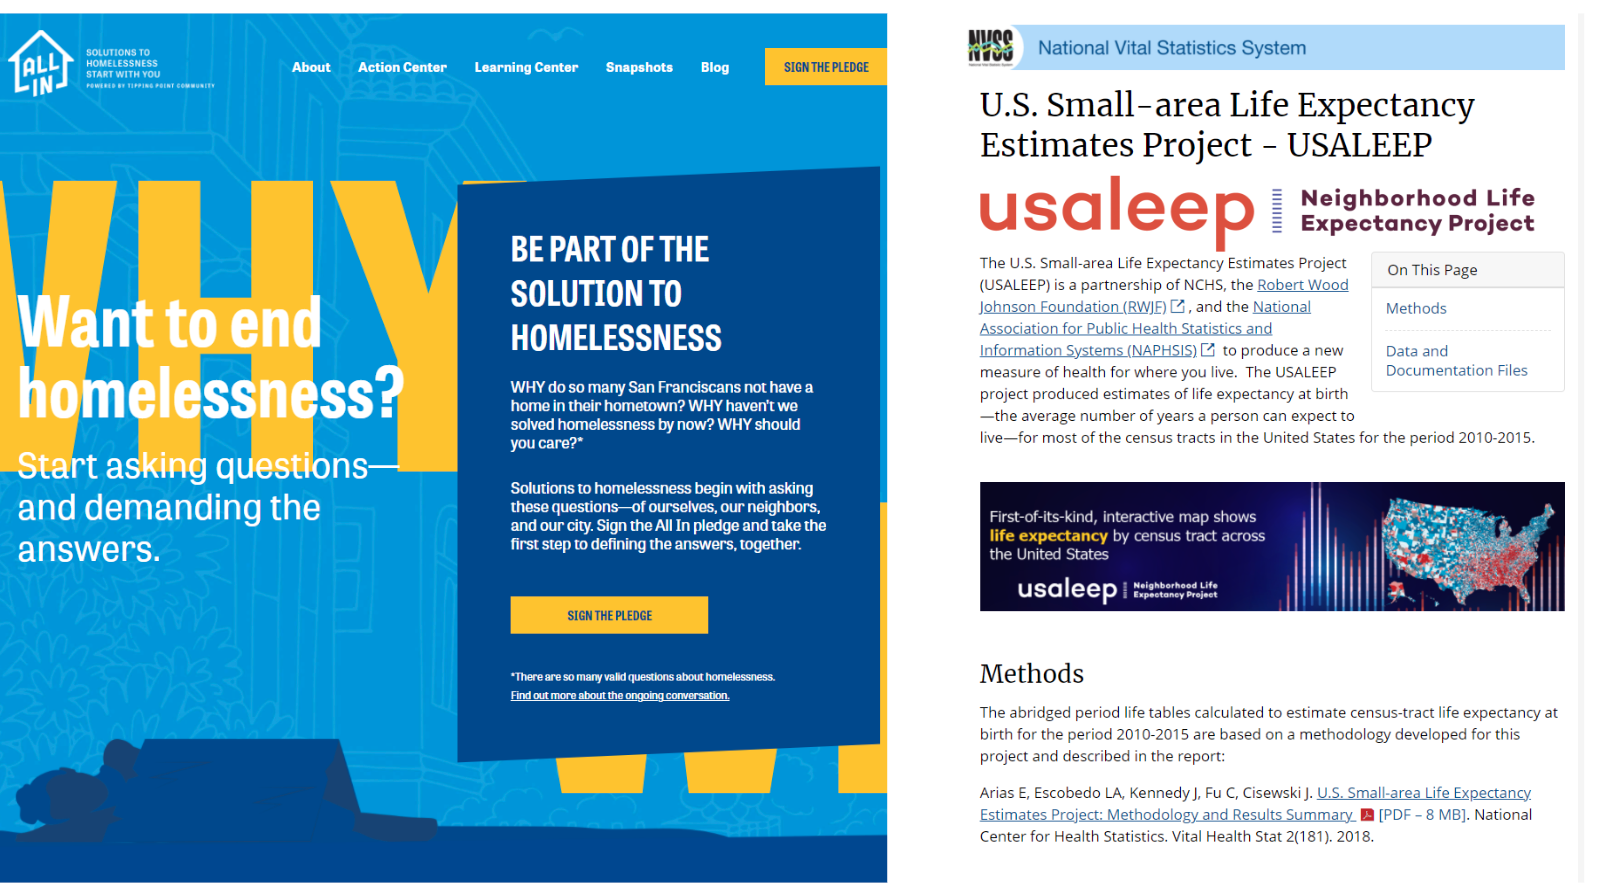
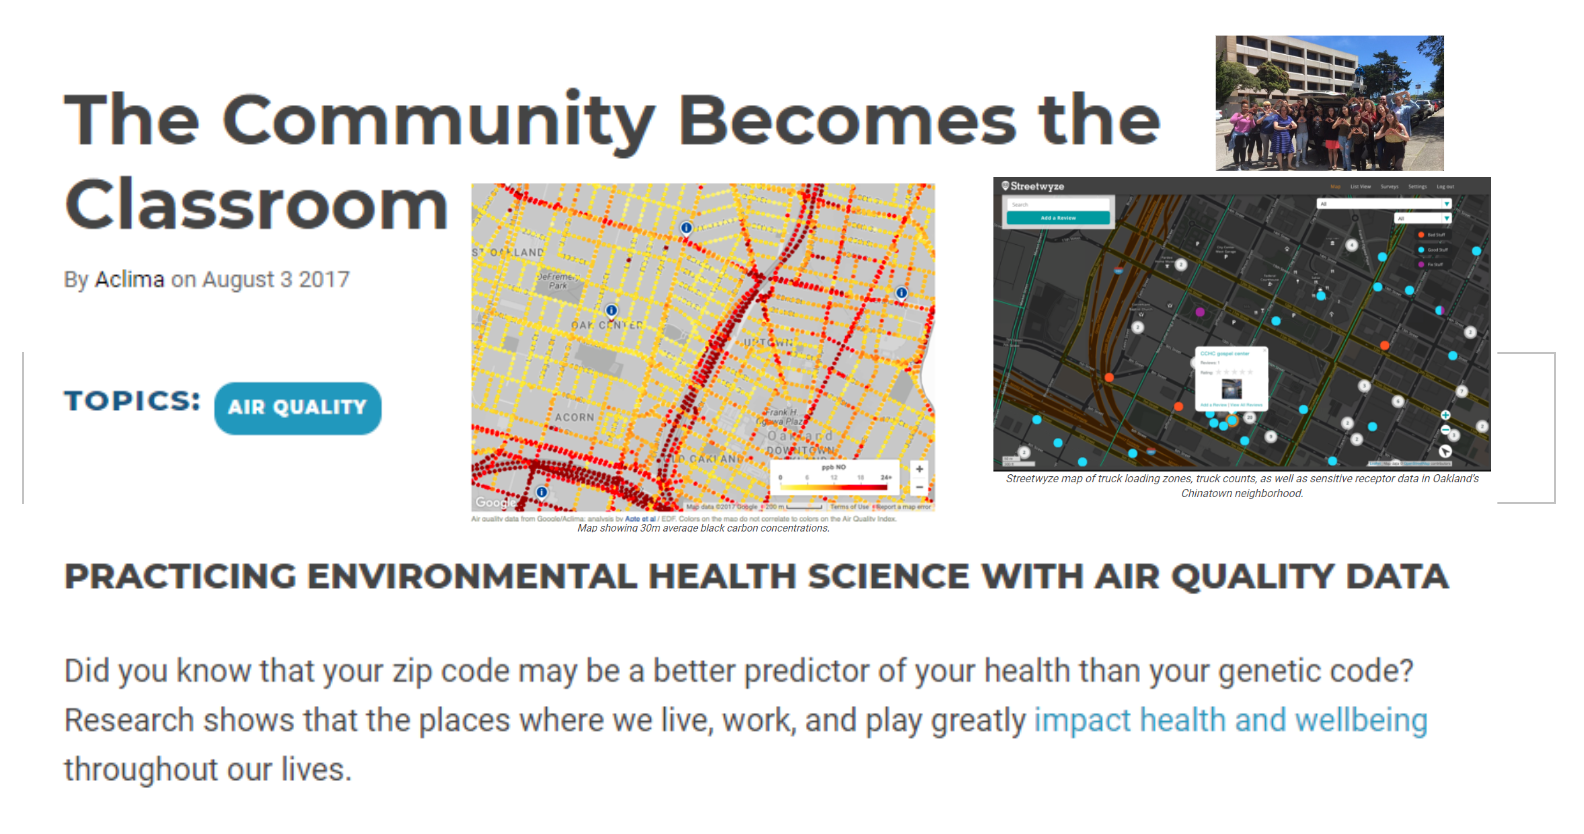
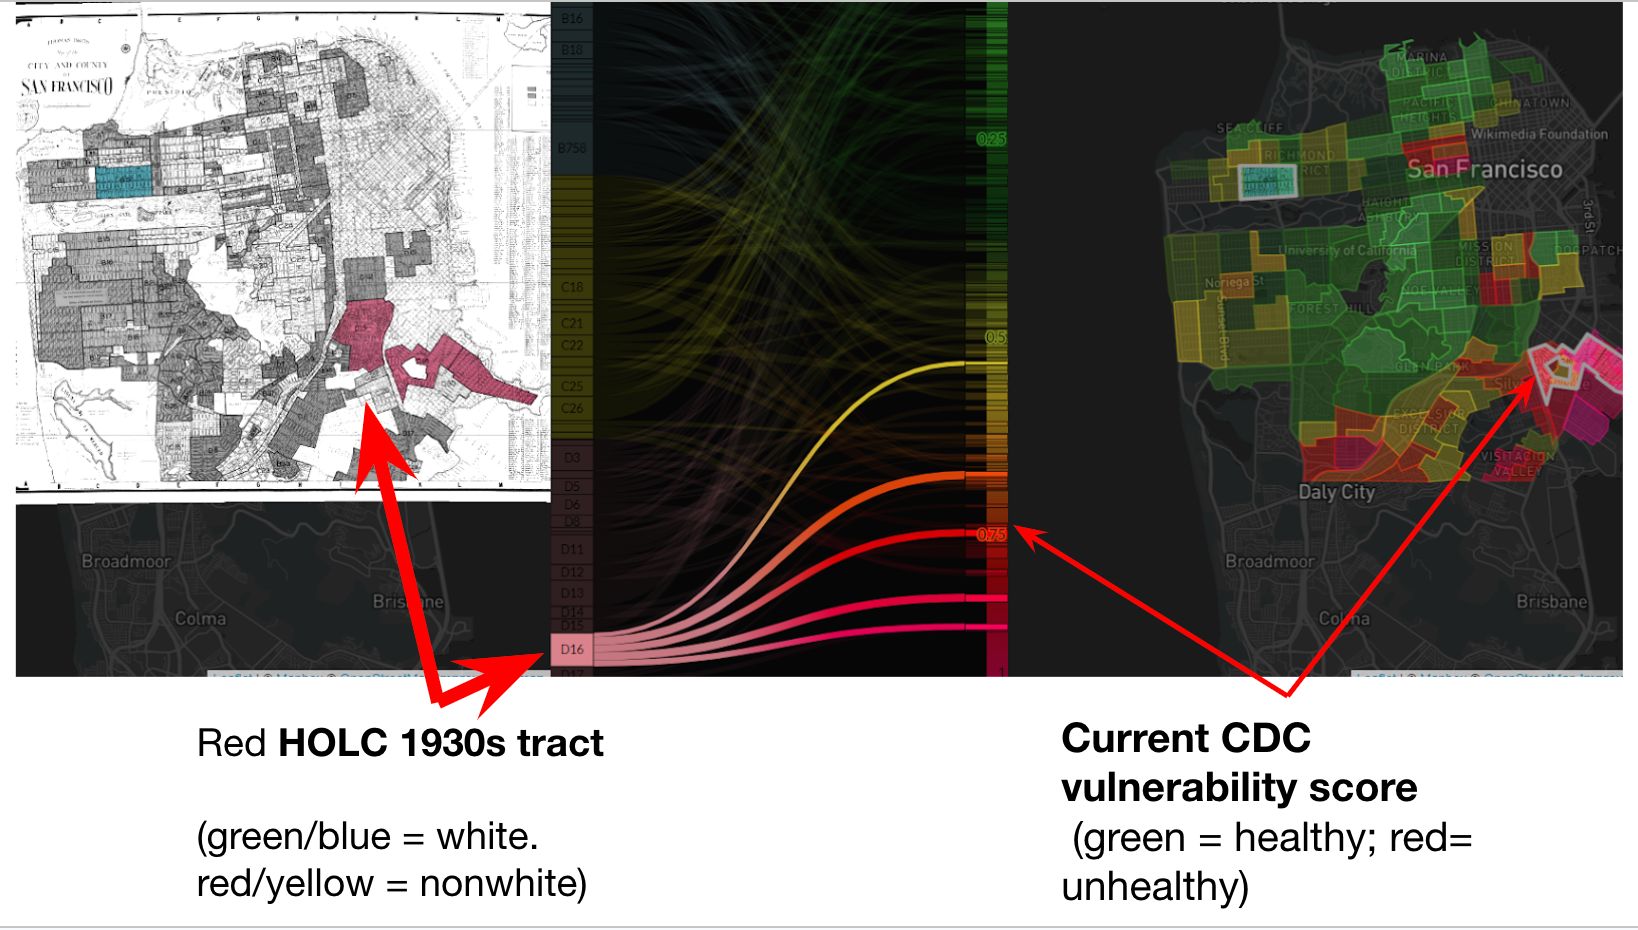
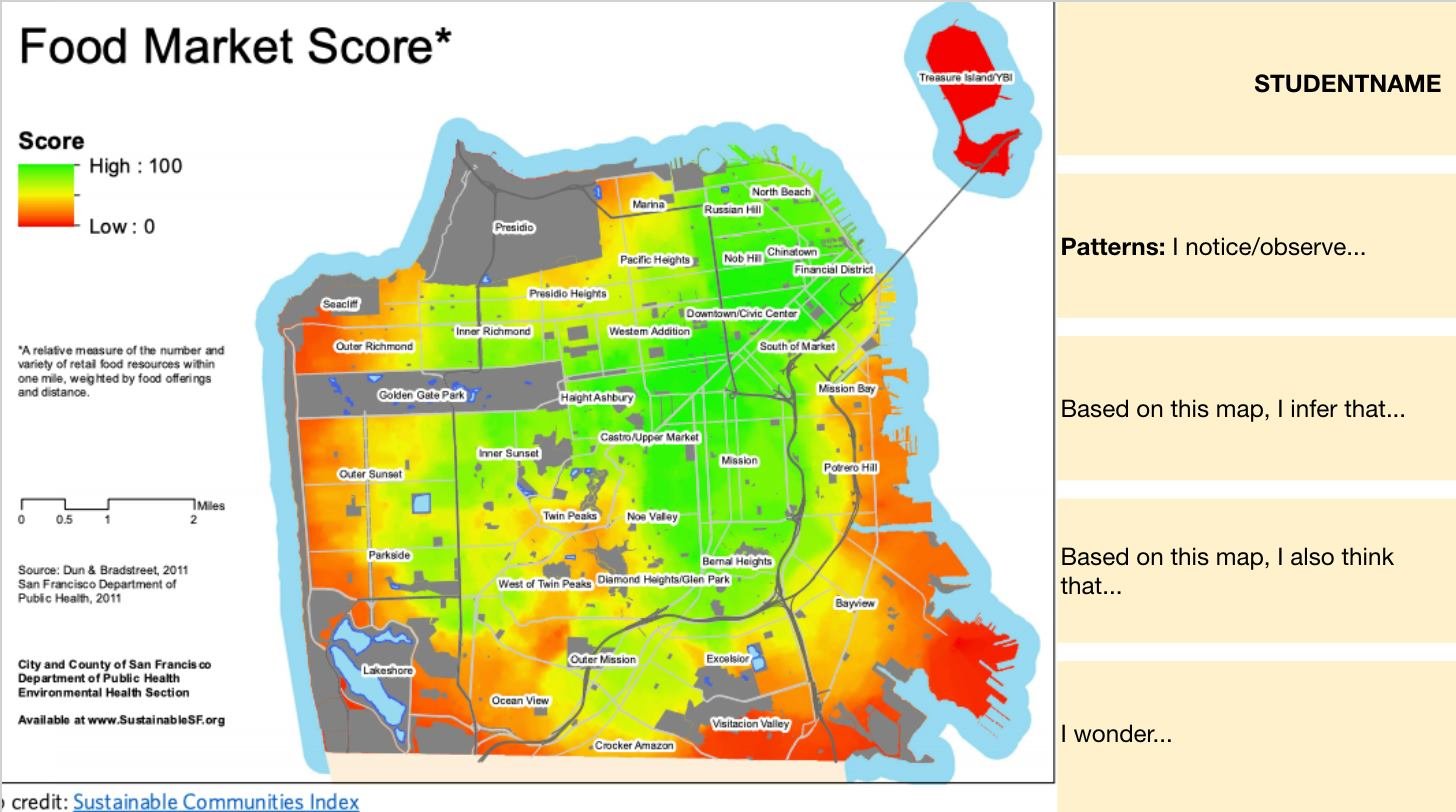
To further spark our ideas for identifying the issues our communities experienced, we then examined a slide deck I created of 30+ KWL slides of San Francisco maps (biological, historical, cultural, political).

Preview:

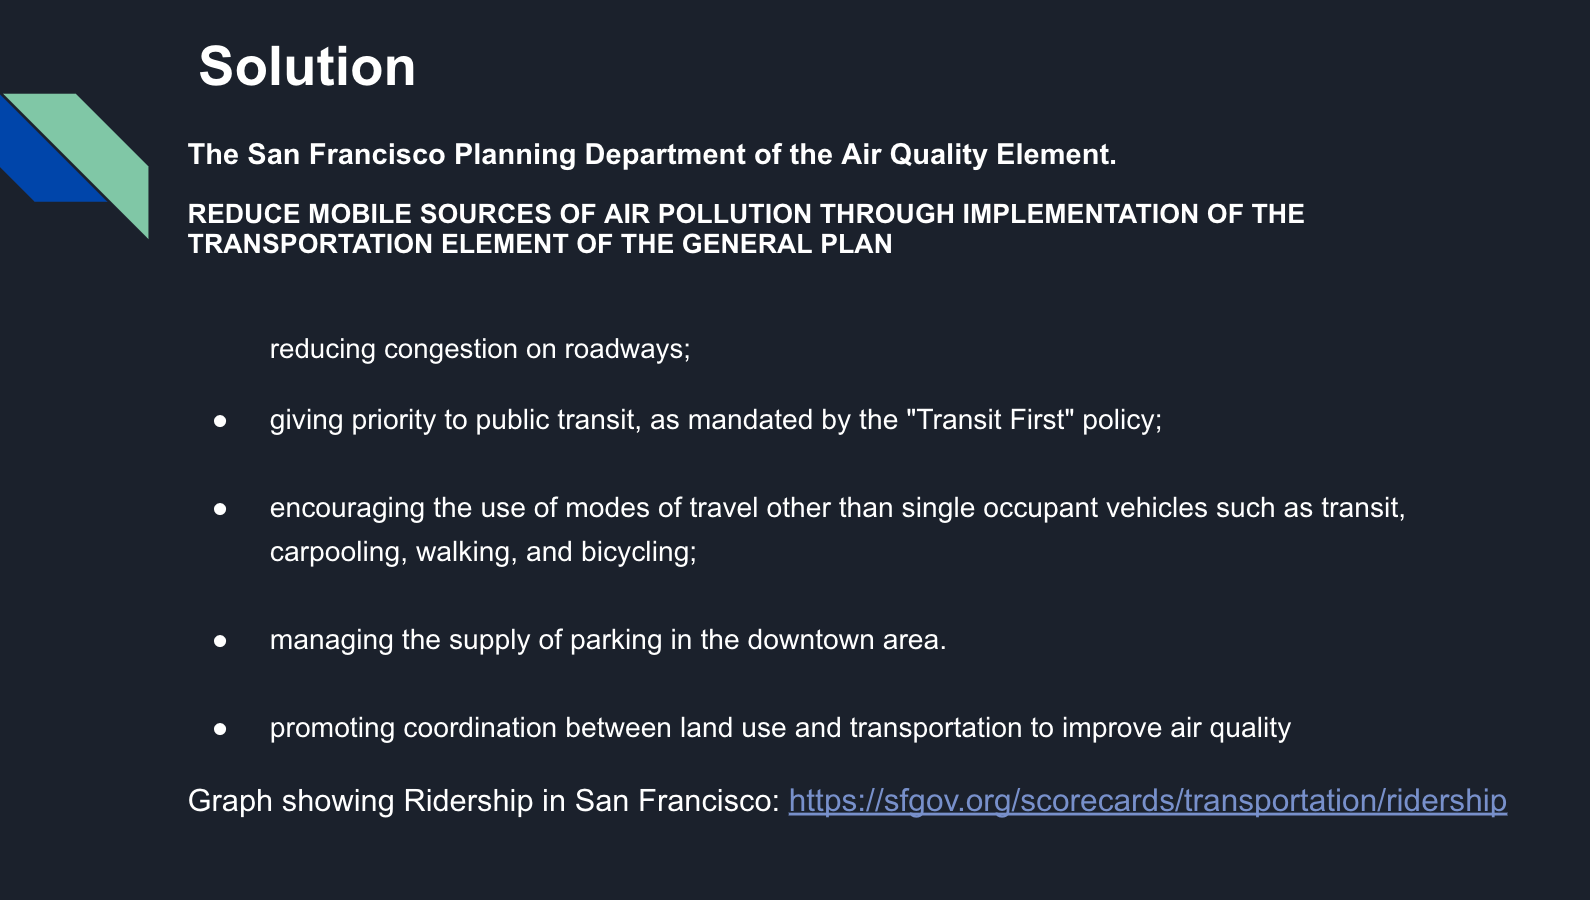
STEP FIVE: RESEARCH AND CRITIQUE A SPECIFIC STRATEGY

Template side for describing and evaluating the solution

Are the strategies used by adults addressing the problems identified?

How does the data support your analysis?

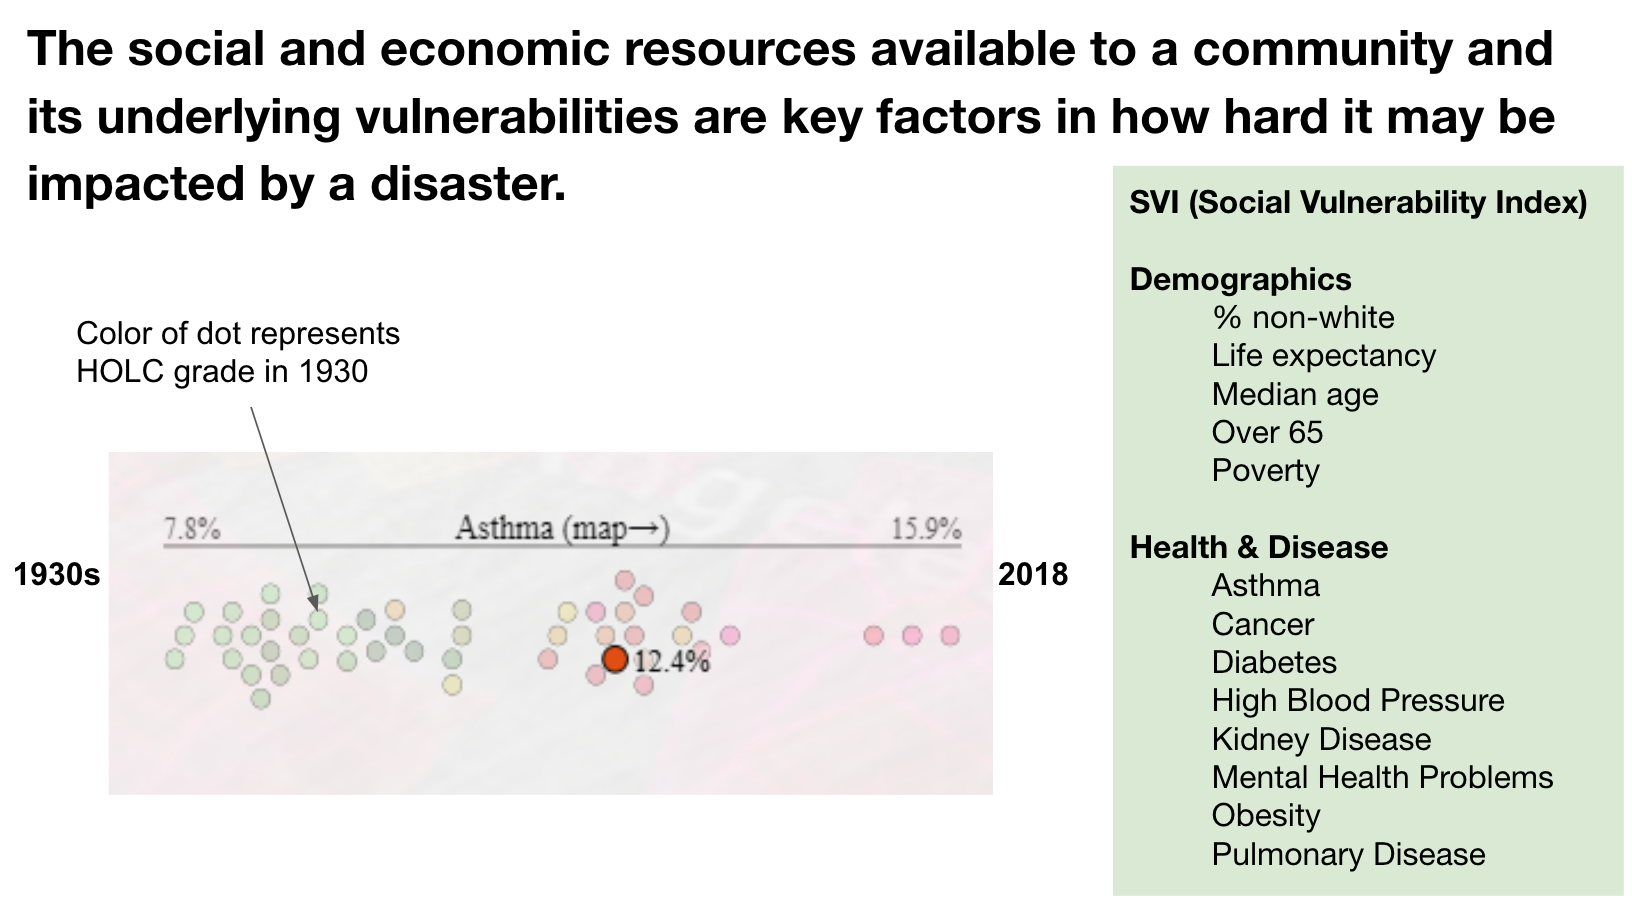
Gallery: examples of factors examined


STEP SIX: CREATE A NEW STRATEGY

Students choose from options below:

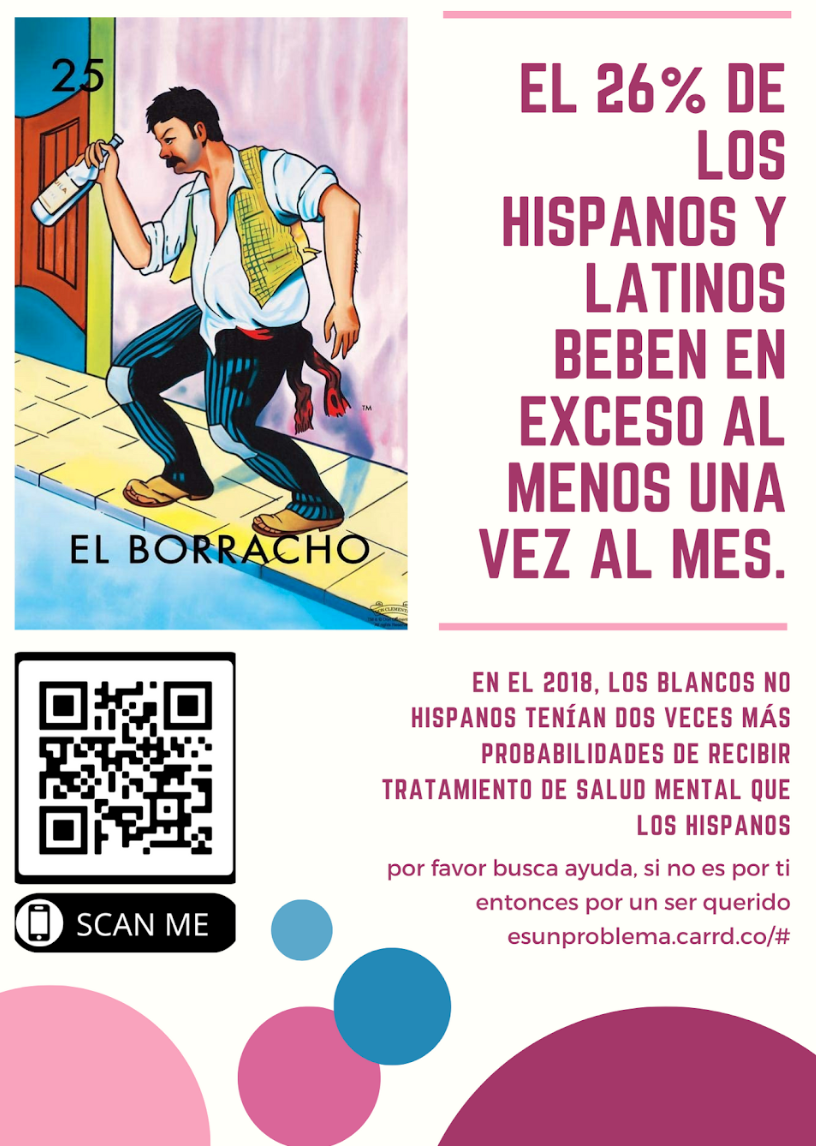
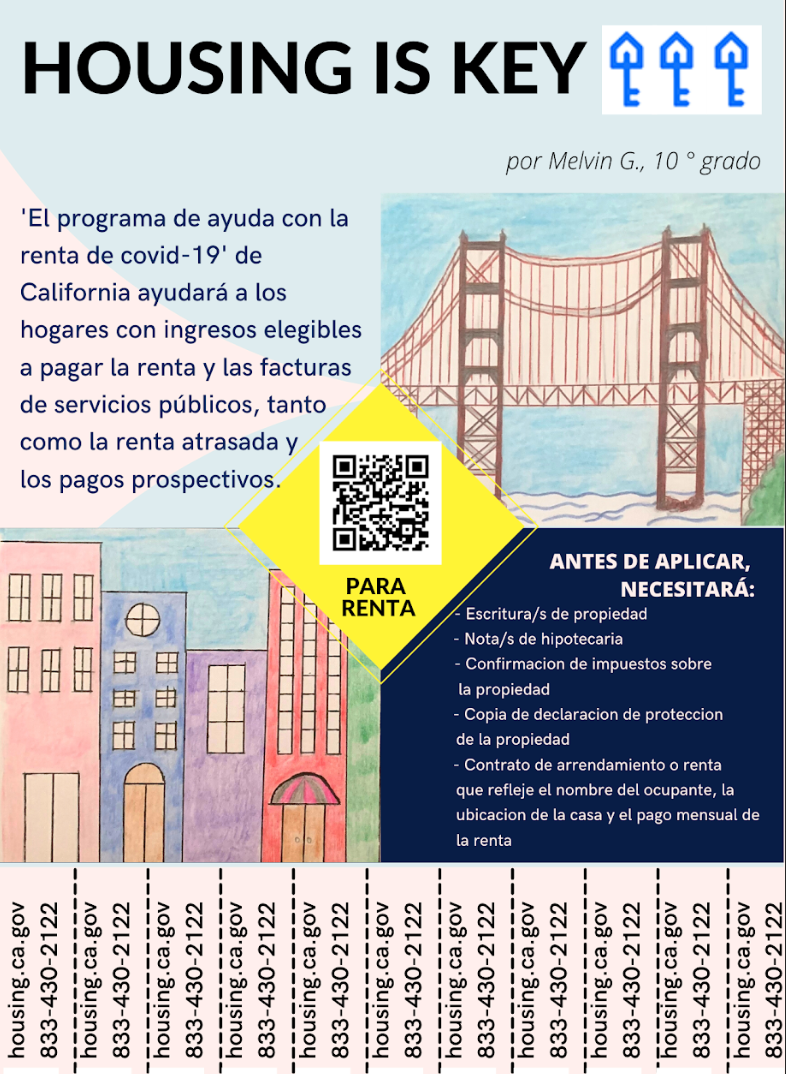
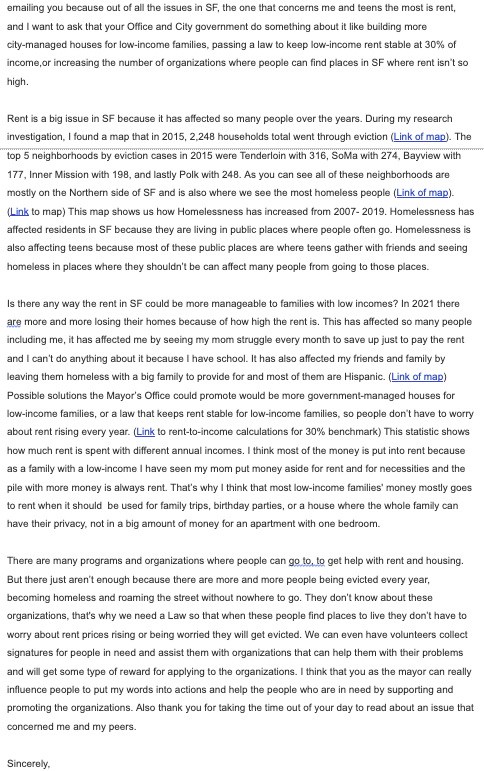
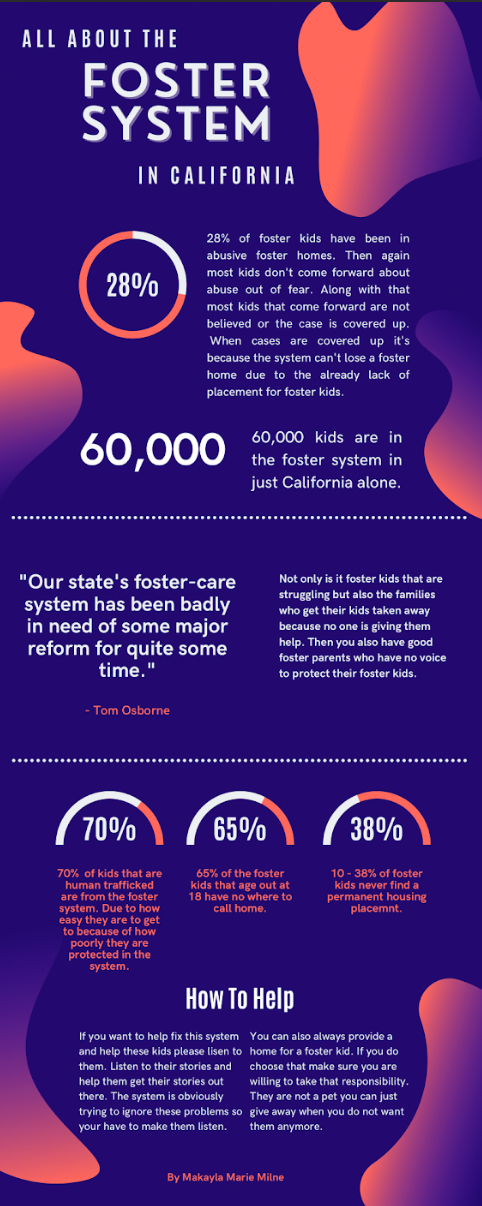
Examples of student projects

(Template for students choosing to use Slides)


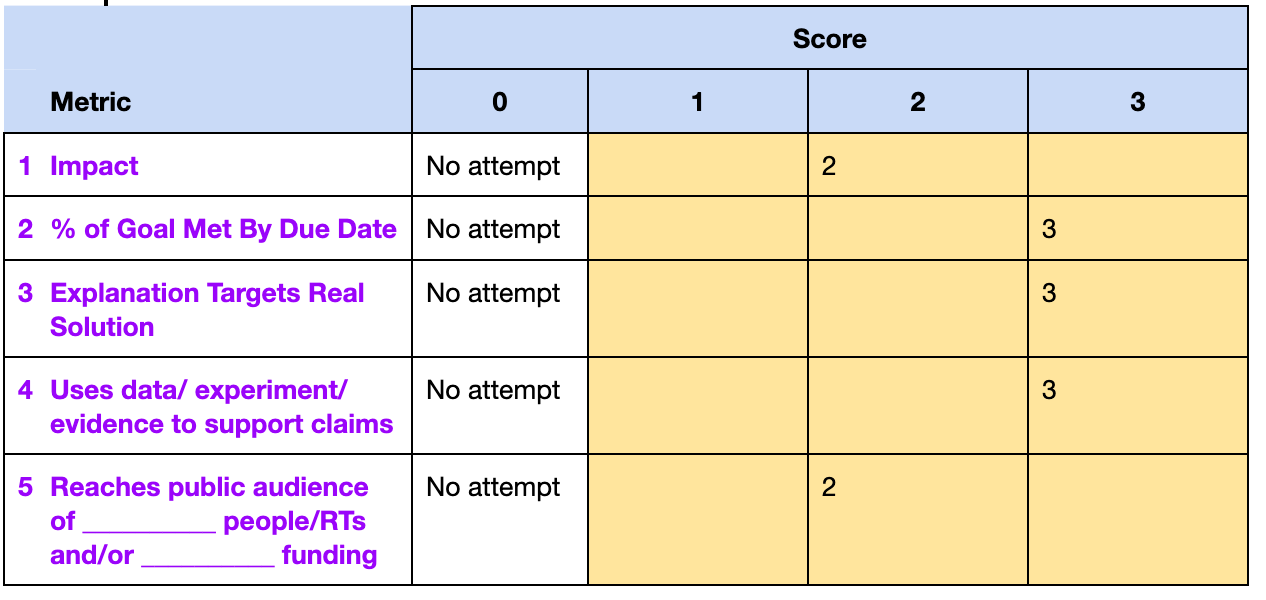
STEP SEVEN: SELF-EVALUATE

Students complete this rubric and grade themselves.


Afterword

The following year, I used it to help bridge interdependent relationships (kelp, their own neighborhoods where they've identified a/biotic factors, etc. and carrying capacity (Rapa Nui, Keeling Curve, covid curve).

I feel like I can do a lot more with this and I will continue to update the slides, embedded links, and more in-depth maps. Feel free to copy and use for your own needs.

Sustainable Strategies (TEK) - environmental justice & indigenous knowledge

Screen Shot 2021-03-17 at 12.00.00 PM.png

Students sign up for 1 of 19 videos, articles, or websites that feature sustainability strategies that come from local knowledge, indigenous peoples, and Black philanthropists and entrepreneurs.

They analyze the source based on how it affects the ecosystem, then reflect on 3 prompts they choose from a list of 9 in Google Forms.


For each slide, student answers these questions:

Screen Shot 2021-03-17 at 11.57.50 AM.png
Screen Shot 2021-03-17 at 11.58.18 AM.png

1. What people and groups are involved and what is their goal?

2. What does this source tell you about the cultural values about food, land, and community? How does one generation trade knowledge with the other?

3. List the crops, organisms, and methods mentioned/shown.

4. How do these people blend past and present knowledge to heal the future? How effective do you think they are or will be?


Strategies included are:

Screen Shot 2021-03-17 at 11.59.32 AM.png
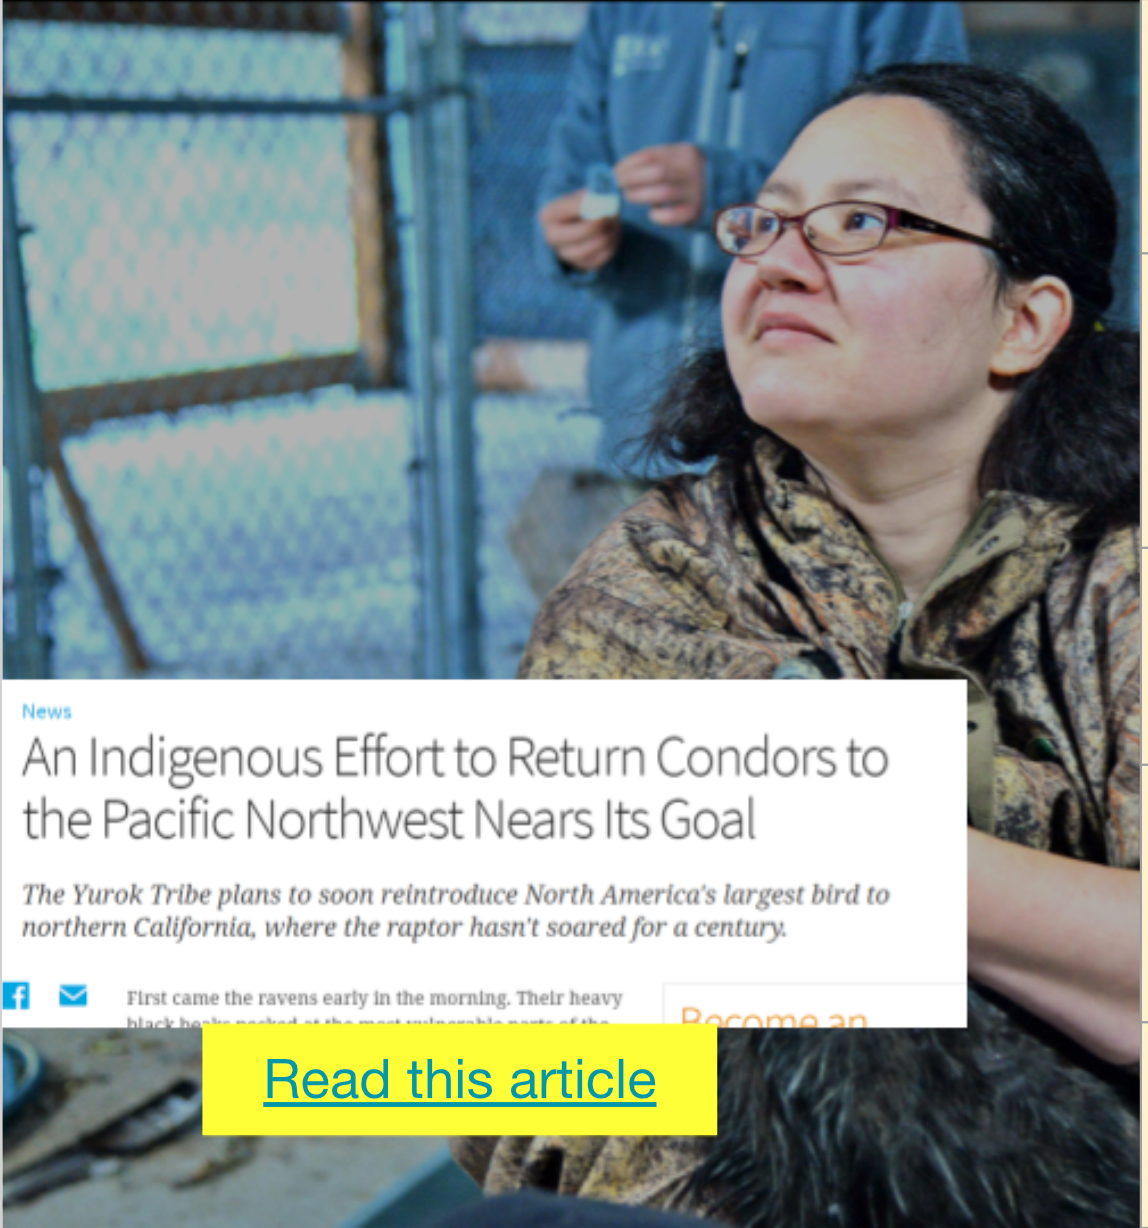
  1. Returning Condors to the PNW (Yurok)

  2. Indigenous fire management

  3. Improving farming with biodiversity in Peruvian cassava

  4. Water Poisoning in Japan, First Nations, and San Francisco

  5. Mayan Forest Garden

  6. Urban Farm: Detroit

  7. Science for a Hungry World

  8. Black Philanthropists Tackle Hunter in the Pandemic

  9. Urban Farm: Dallas

  10. Blossoms of Hope, Oregon

  11. 'Homecoming' trailer

  12. Heritage Crops in New Mexico

  13. First Nations students in Sustainability Careers

  14. Ash trees - Akwesasne Mohawk

  15. Salmon - Lummi Nation

  16. Water - Campo Kumeyaay Nation

  17. Wild Rice - Leech Lake Ojibwe

  18. White Earth Land Recovery Project

  19. American Indian Foods Guide


Reflection

Reflection: Students choose 1 from 3 sets of prompts.

Reflection: Students choose 1 from 3 sets of prompts.

Students choose 1 from 3 sets of prompts.

Multi-level Trophic Pyramid Simulation Webquest

Multi-level Trophic Pyramid Simulation Webquest

Contains instructions for setting up a trophic pyramid, with screenshots and questions.

At the end of this group synchronous activity, students write an individual CER for a claim around carrying capacity.

Option to tie to logarithmic/exponential population growth & covid-19 ("what's the limiting factor for covid-19?").

120493222_10112404486246921_2862221156392734612_o.jpg

Google Form Quiz & Slides: Observe A/Biotic factors & evaluate CER of 2 mask-wearing-CO2 arguments

I made a Google Forms that asks Ss to:

  1. 1) identify a/biotic factors (shows video & asks students what they think of different models),

  2. interacting,

  3. in their neighborhood.

It then asks copypaste for a CER analysis of 2 covid-19 mask-CO2 arguments. The only ones with pts have Feedback that automatically responds with the correct answer.

(English & Spanish.)

Screen Shot 2020-09-20 at 10.29.59 AM.png

Lesson (2x): Energy Flow Through Food Webs

Prior knowledge: types of energy & matter, symbiotic relationships, levels of organization (individual -> ecosystem)

Includes:

  • review practice for terms & concepts

  • role cards & setup instructions

  • kinesthetic activities (card sort, role playing simulation)

  • graphing tasks (prior class data included)

  • discussion using videos to inspire & extend


Agenda

1. Do Now

a) flow chart of morning routine (intro) (skip to #2.)

b) photosynthesis from space & food in body (skip to #5.)

I. Matter, Energy, Symbiotic Relationships

2. Terminology Check

a) Symbiotic Relationship Examples

b) Card Sort: Symbiosis

3. Energy

a) Card Sorts: Types of Energy

b) Venn Diagram: Energy vs. Matter

+ optional HW: Reporting Climate Change

4. Discuss & Elaborate on how to obtain energy

a) Video: Coral - Predator? Producer? Both?

b) Video: Farallones Islands & complex relationships

II. Food Web, Trophic Levels, Energy Transfer

5. Activity: Ocean Food Web

a) Game, Graph, Analyze, Discuss

b) Define trophic level roles (HW)

6. Videos for Discussion

a) Why are detritovores important for the food web? (Explain)

b) Kelp Ecosystem (Extend)

c) Coral Reef Symbiosis (Extend)

d) Ecosystems & Ecological Communities (Explain)

e) How does climate change affect biodiversity (Extend)

f) Food Chains vs. Food Webs (Explain)

6. What’s missing in the trophic pyramid?

7. Exit Ticket

a) energy sources & transfer

b) How is the Internet like a food web?

Lab: Exploratorium's Ocean Acidification In A Cup

Time: 60 min

Goal: Model an ocean-atmosphere interaction and explain how carbon dioxide gas diffuses into water, causing the water to become more acidic.

Includes:

  • Lab worksheet (instructions, questions, etc.)

  • Slides for Exploratorium’s Ocean Acidification In A Cup

  • Videos with timers, safety review, and lab procedure demo, applications to coral bleaching, etc.

Note to self: (To Do) add inquiry-driven portion for students to devise questions together (requires more chemistry than mere carbon cycling stations activity)