Data Science, Human Geography, & Environmental Justice Youth Project (DL compatible)
Data Science, Human Geography, & Environmental Justice Youth Project
Inspired by Undesign the Redline PBLs, Rebecca Solnit’s Infinite City, and the intersectionality my students navigated every day, I resolved to honor their distance learning investment by making the ecosystem and data analysis about their new pandemic-era environment. My students wanted to learn how to help, instead of remaining silent and isolated from what science was wrestling with in reality, both in terms of research and outreach. Learning human geography in the context of how to define life during the pandemic and how to design metrics for answering scientifically testable questions was one way they could figure out how to cope with daily catastrophe and grief.
STEP ONE: SURFACE EXISTING KNOWLEDGE & ESTABLISH COMMUNITY CONTEXT.
First I asked students to mark on a blank map of San Francisco where they lived (or where they were willing to report) in relation to the school. Students noticed certain patterns and created questions about it said about the students or the school.
STEP TWO: INVITE SHARING SOMATIC OBSERVATIONS TO IDENTIFY LAYERS OF PATTERNS.
We used a padlet to share the 5 senses we could describe in our own separate neighborhoods across the city, and used that to create a summary of the communities and the questions they presented.
Students developed their own sense of purpose and curiosity when their sense of intersectionality was acknowledged and made explicit through formalized data.
Some possible prompts:
What kinds of places do you go to relax or be at peace? Any green spaces? How far away are they?
What kinds of people live near you? How would they describe themselves?
How do the people around you make a living?
What products do you or people around you use? What brand names do you see most often?
What medical or health needs do you notice in people around you?
What sounds do you hear around you?
What smells do you sense?
STEP THREE: IDENTIFY ISSUES.
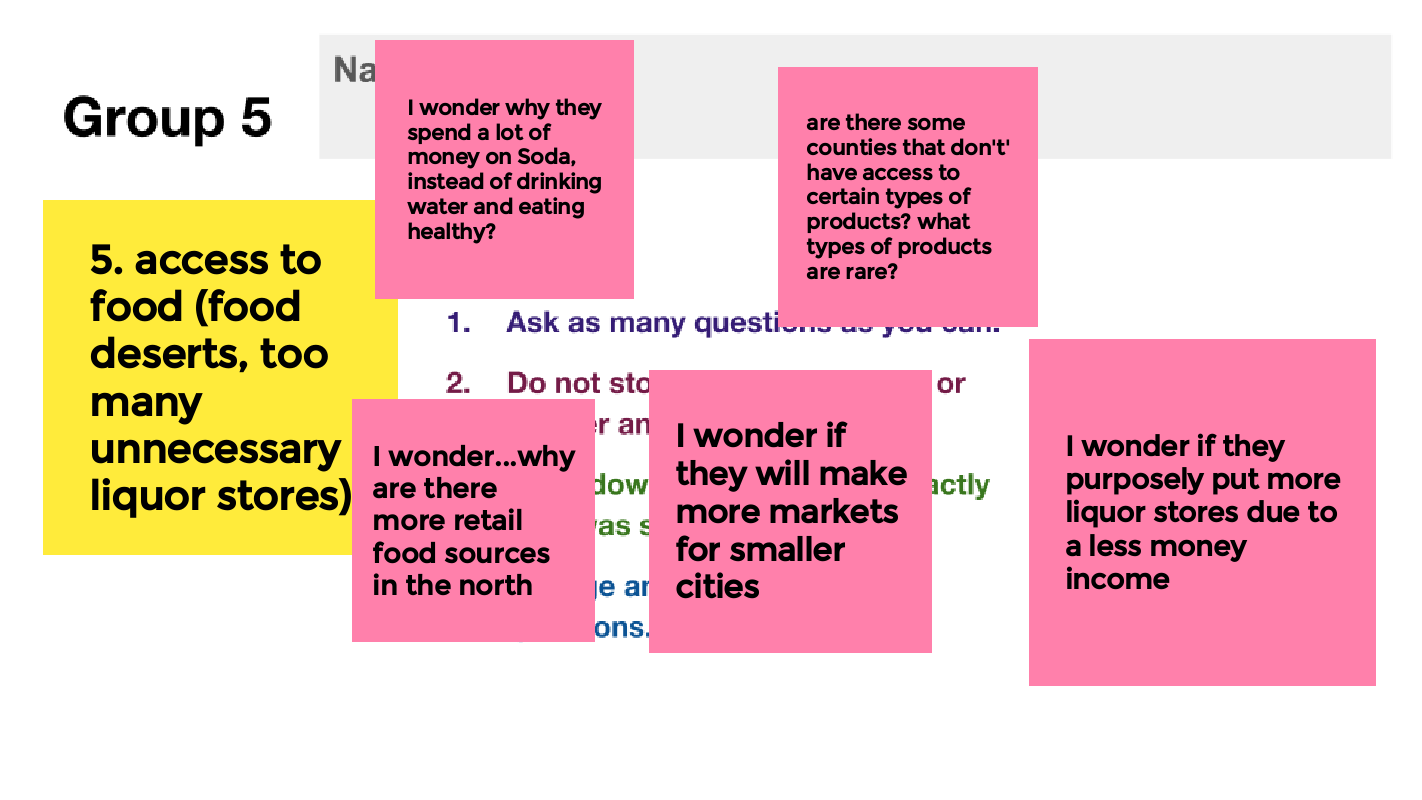
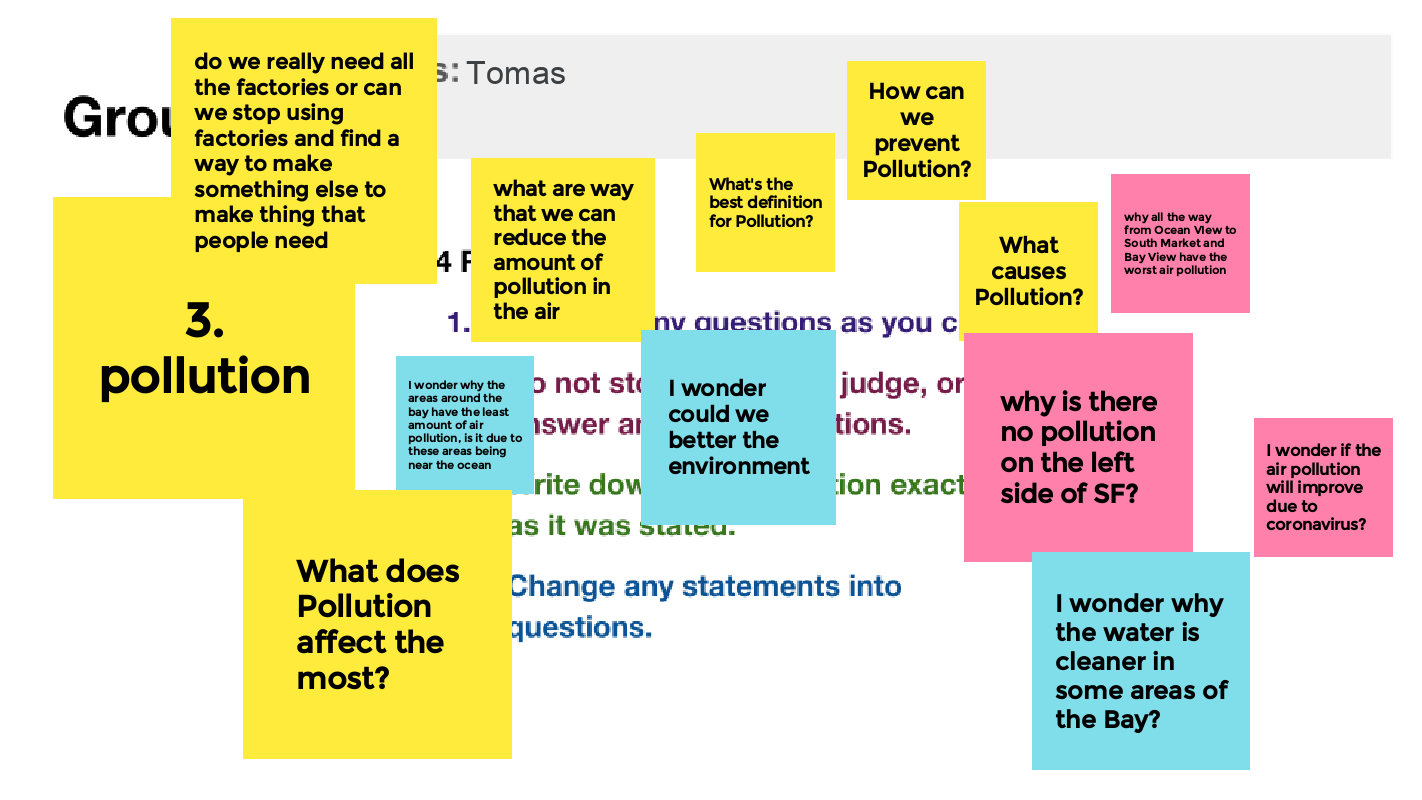
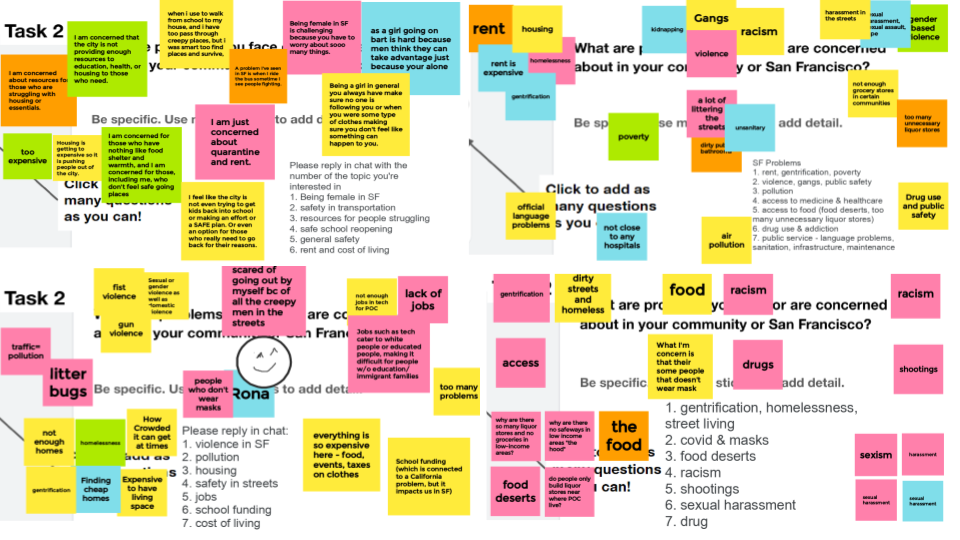
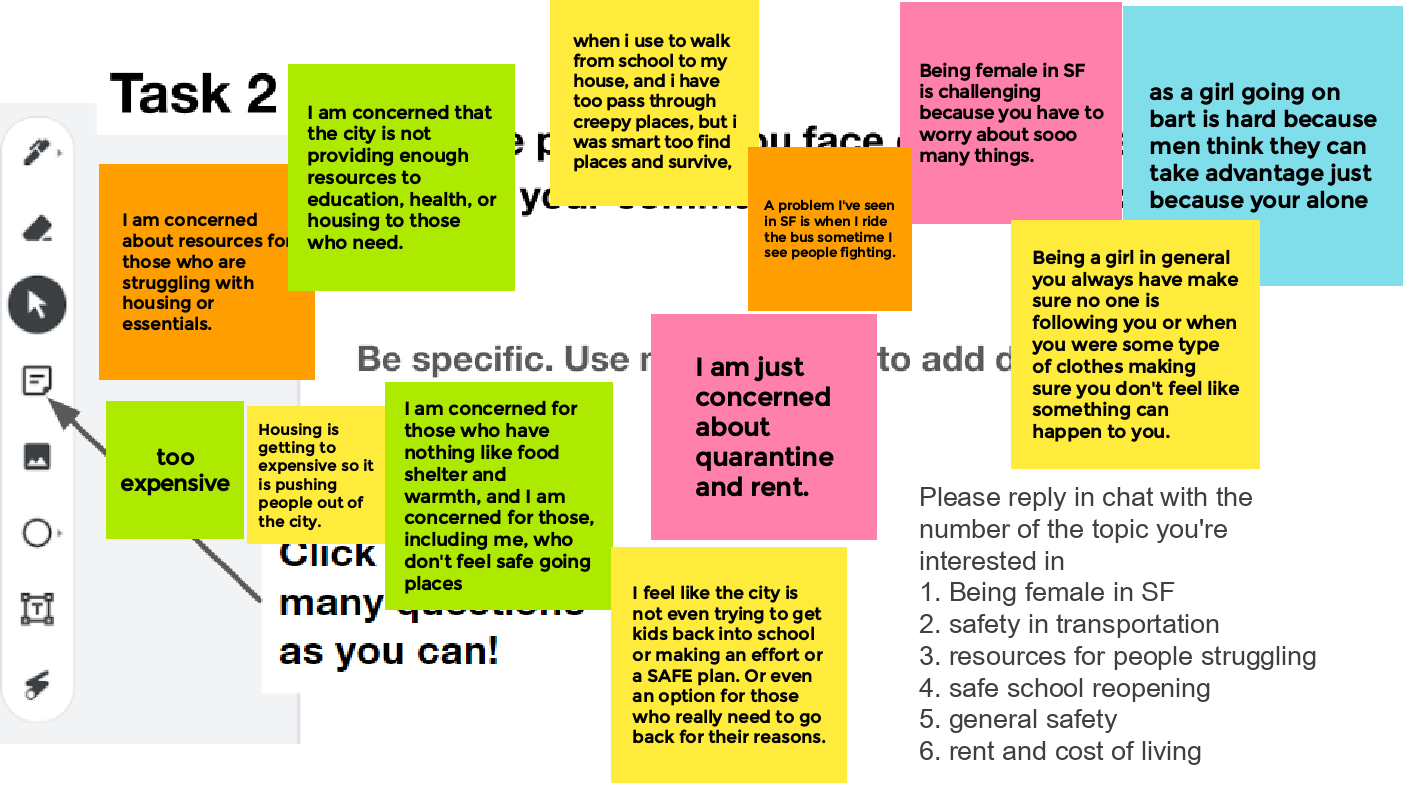
Approach: Question Formulation Technique based on recent headlines. Gathered a Jamboard of recent headlines based on patterns identified in Step 2 and asked students to add questions. Students then discussed further in another Jamboard to talk further about experiences in the city. During physical classroom learning, students used post-it notes and others added to a padlet.
Preview (distance-learning Jamboards)
STEP FOUR: EXPLORE AND ANALYZE DIFFERENT LAYERS AND TYPES OF DATA TO INFORM FOCUS.
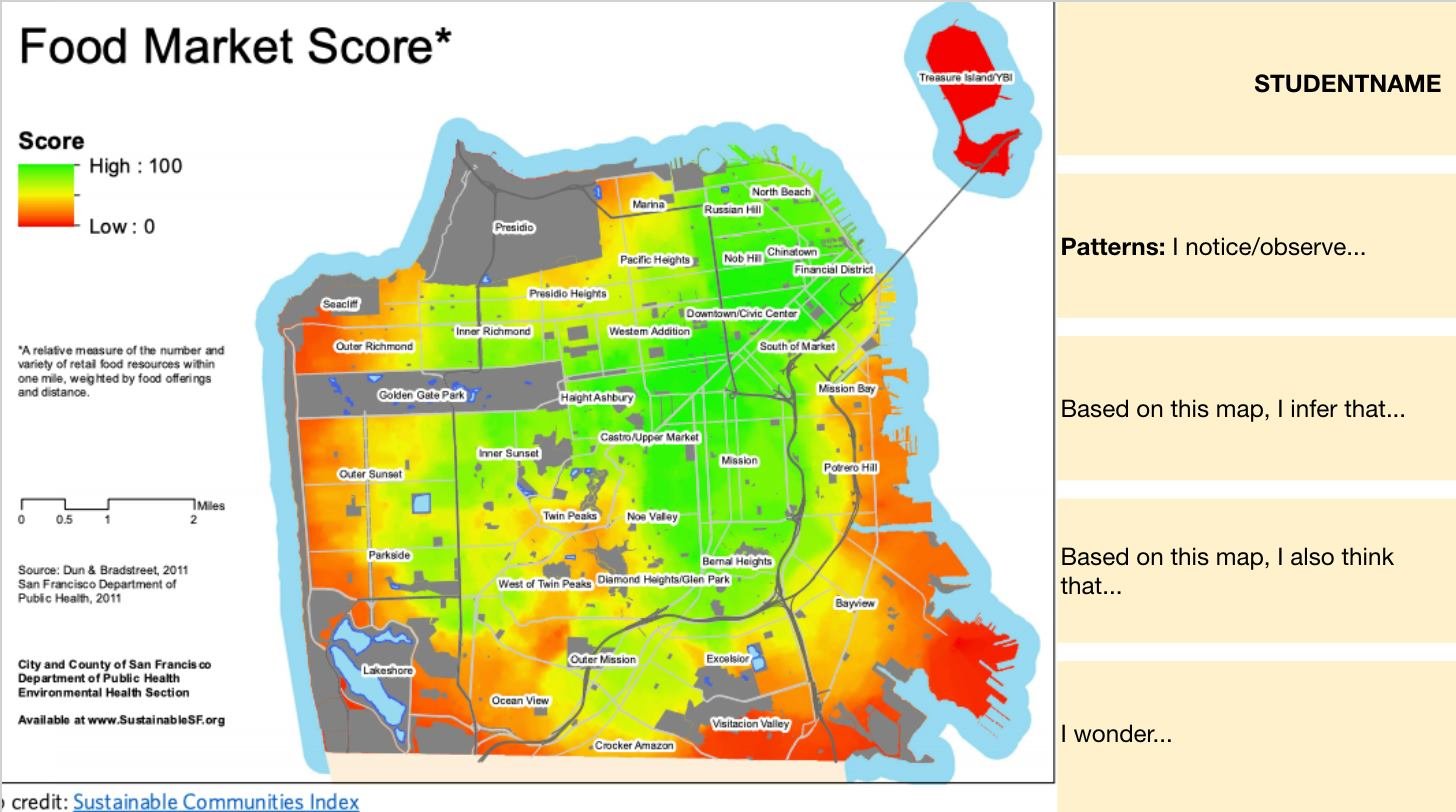
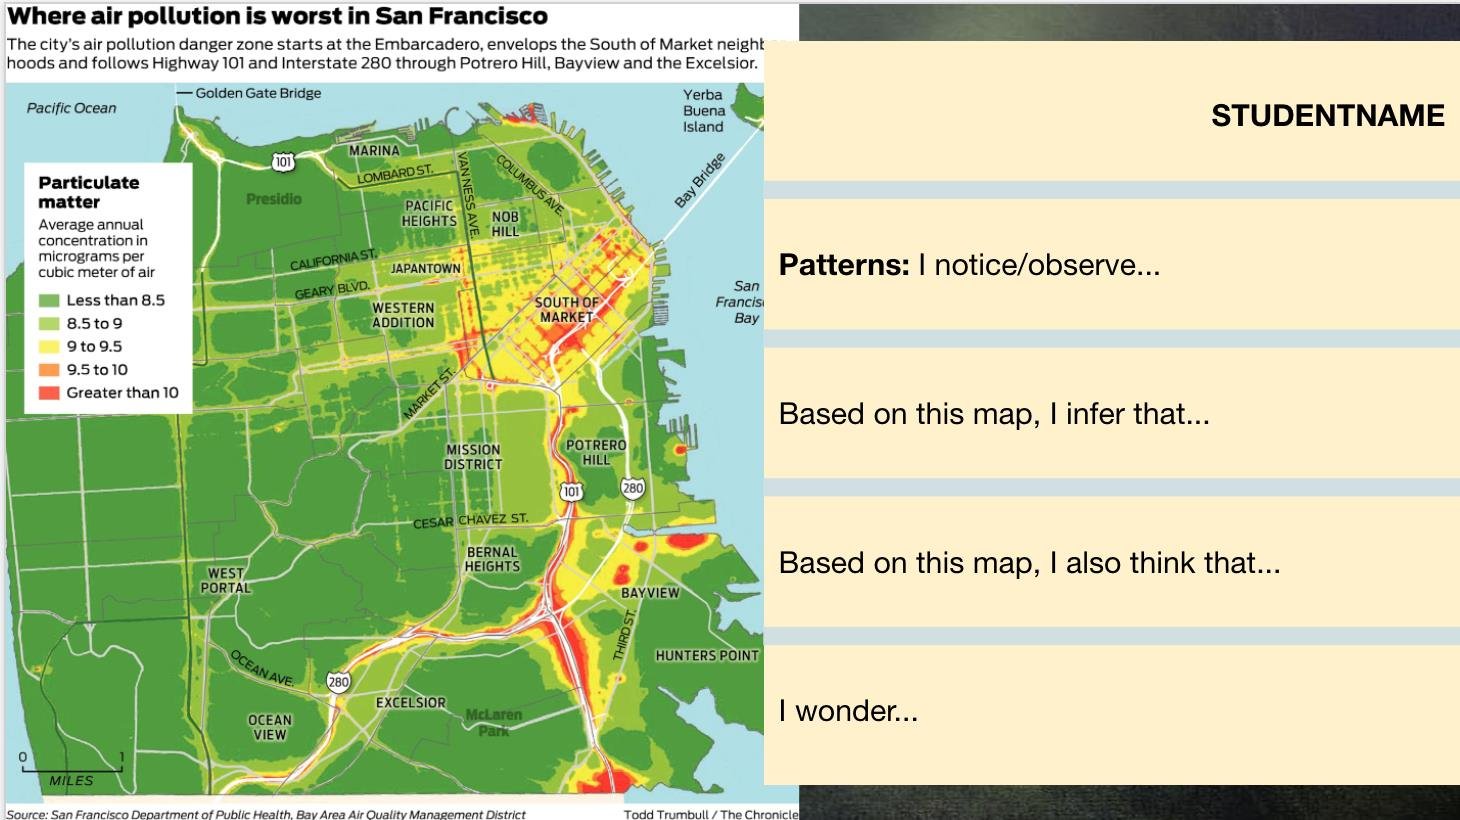
To further spark our ideas for identifying the issues our communities experienced, we then examined a slide deck I created of 30+ KWL slides of San Francisco maps (biological, historical, cultural, political).
Preview:

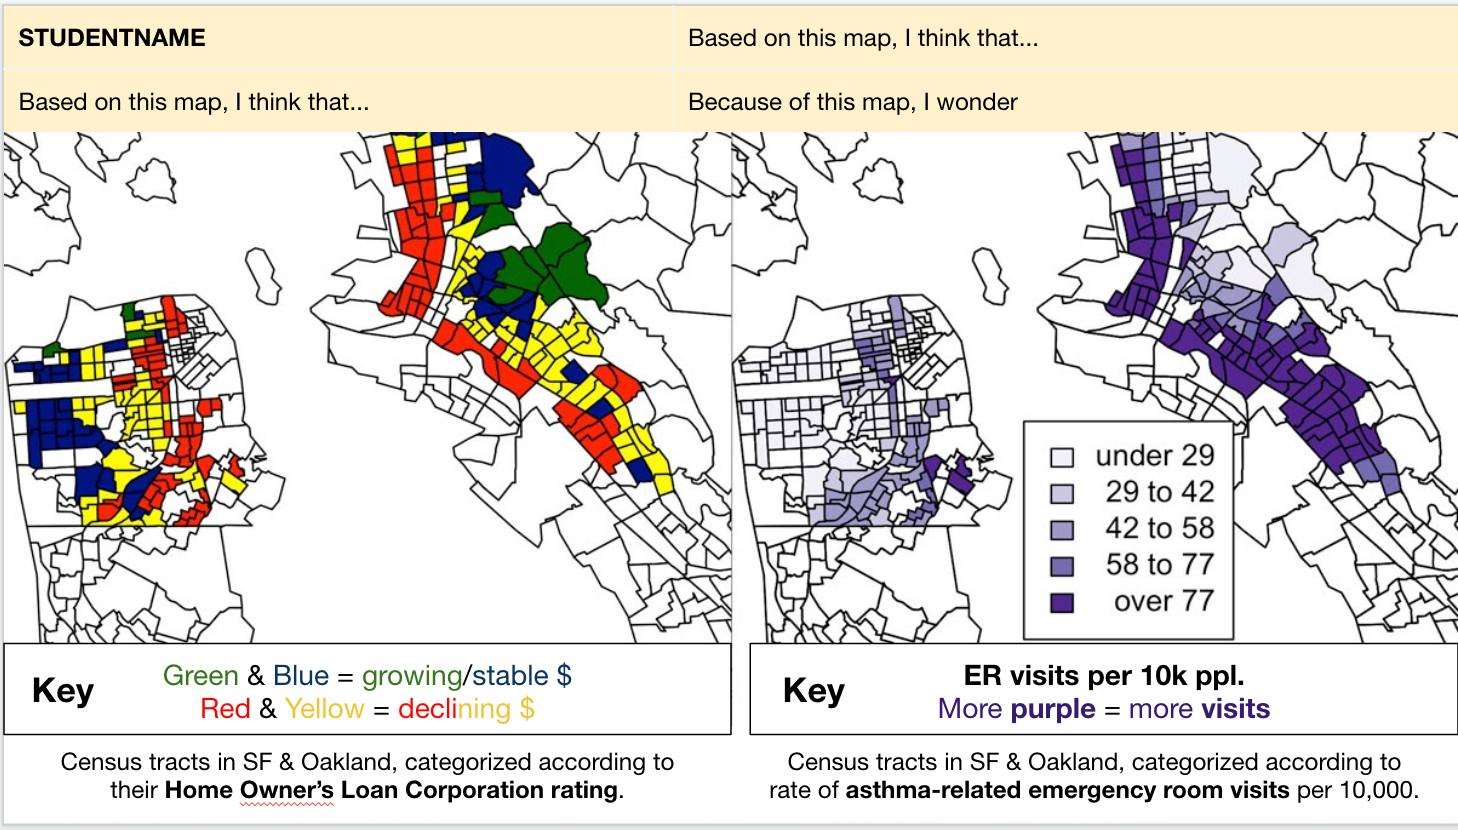
STEP FIVE: RESEARCH AND CRITIQUE A SPECIFIC STRATEGY
Are the strategies used by adults addressing the problems identified?
How does the data support your analysis?
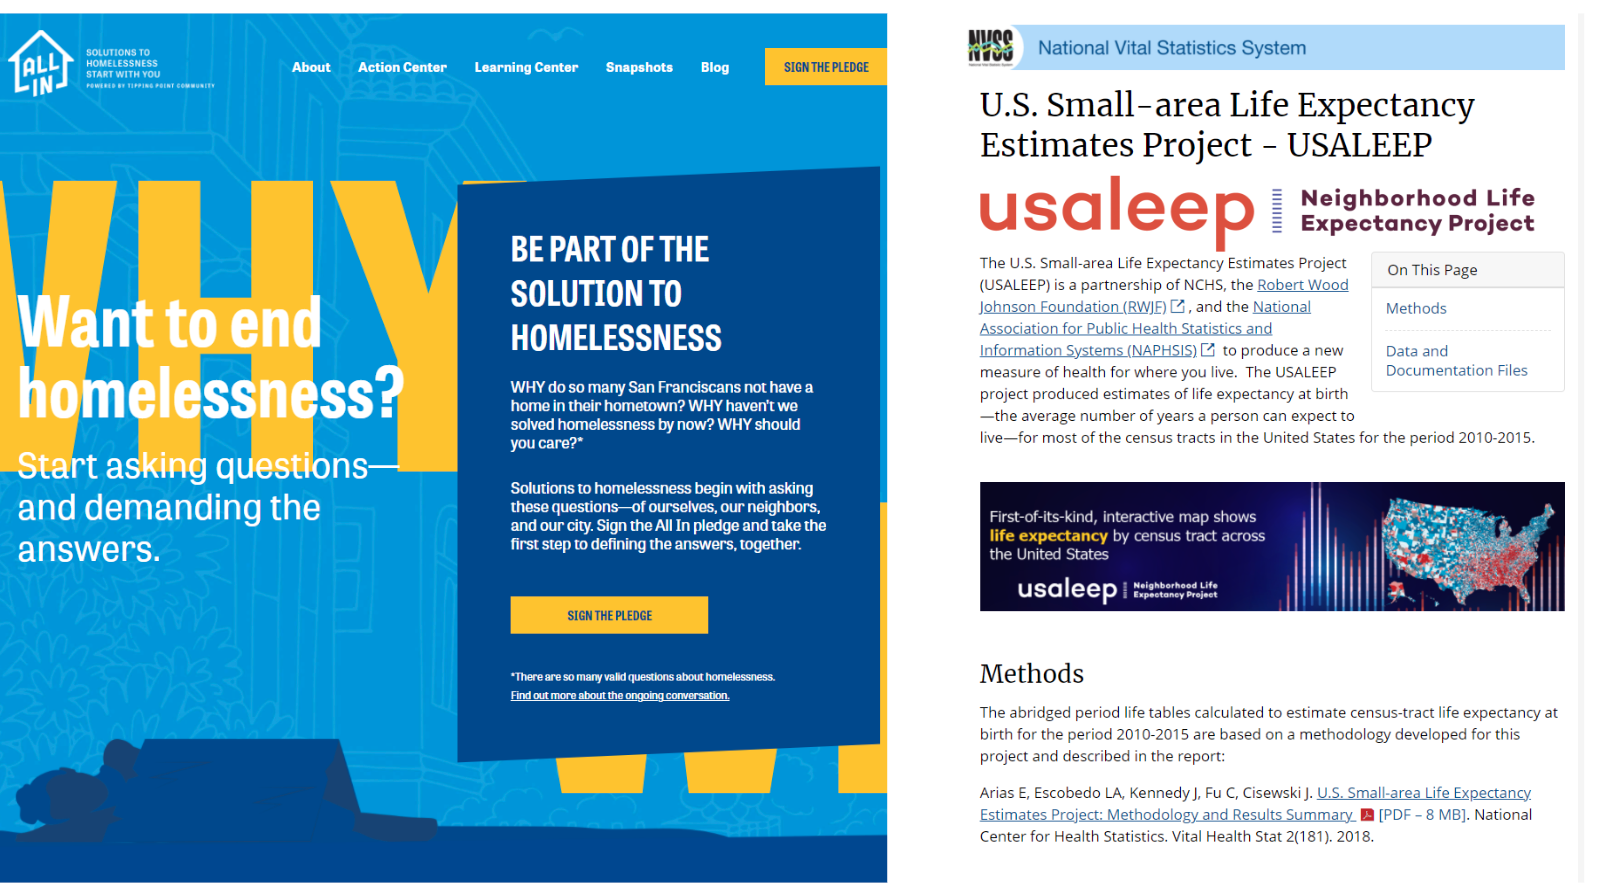
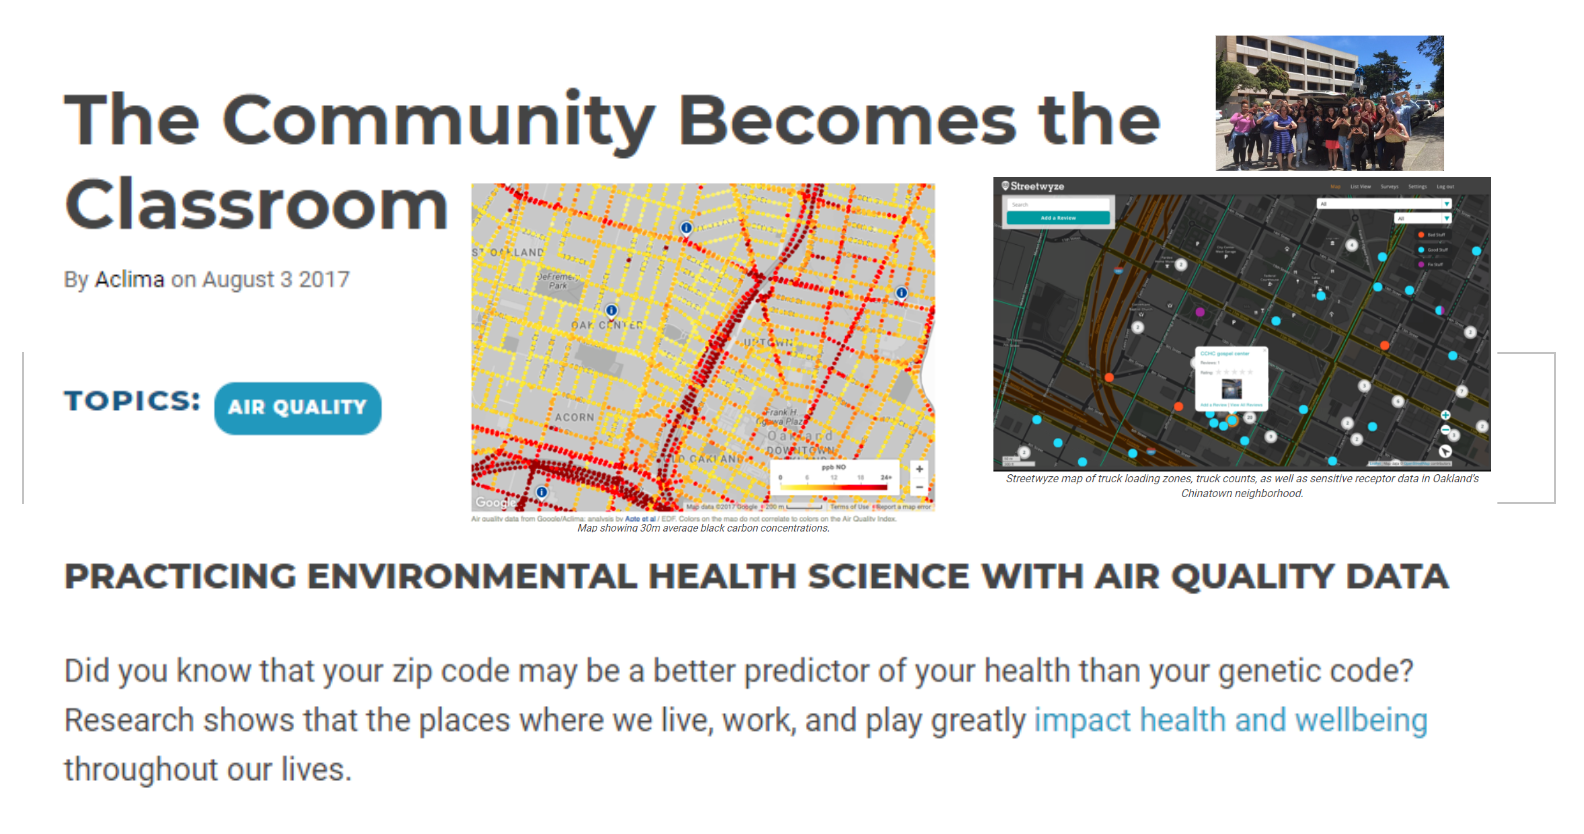
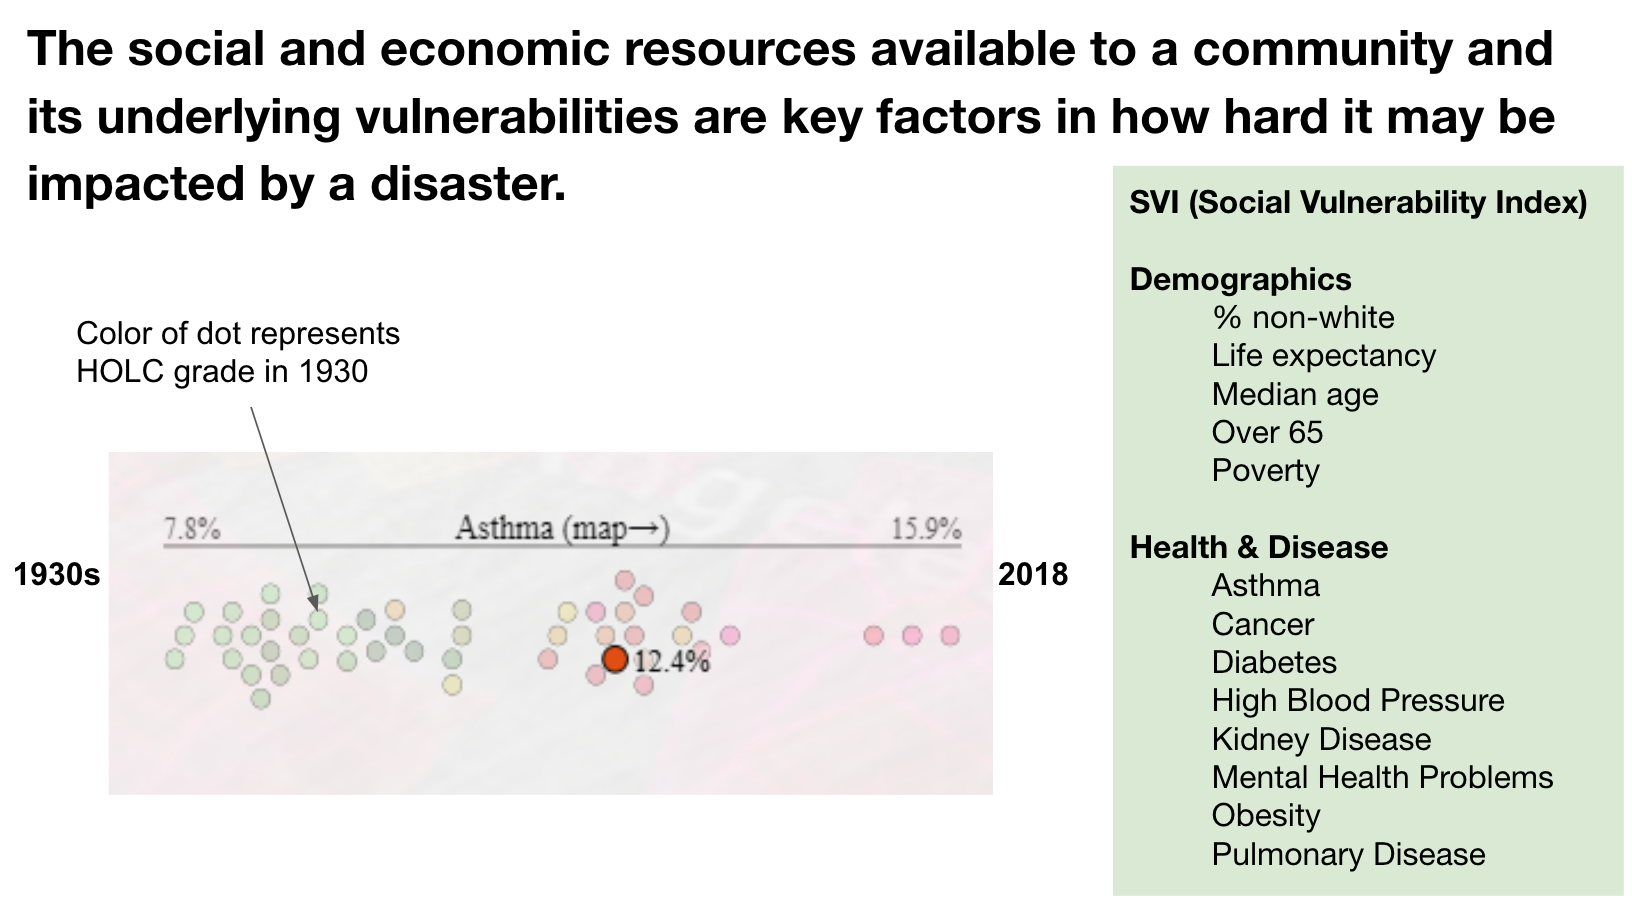
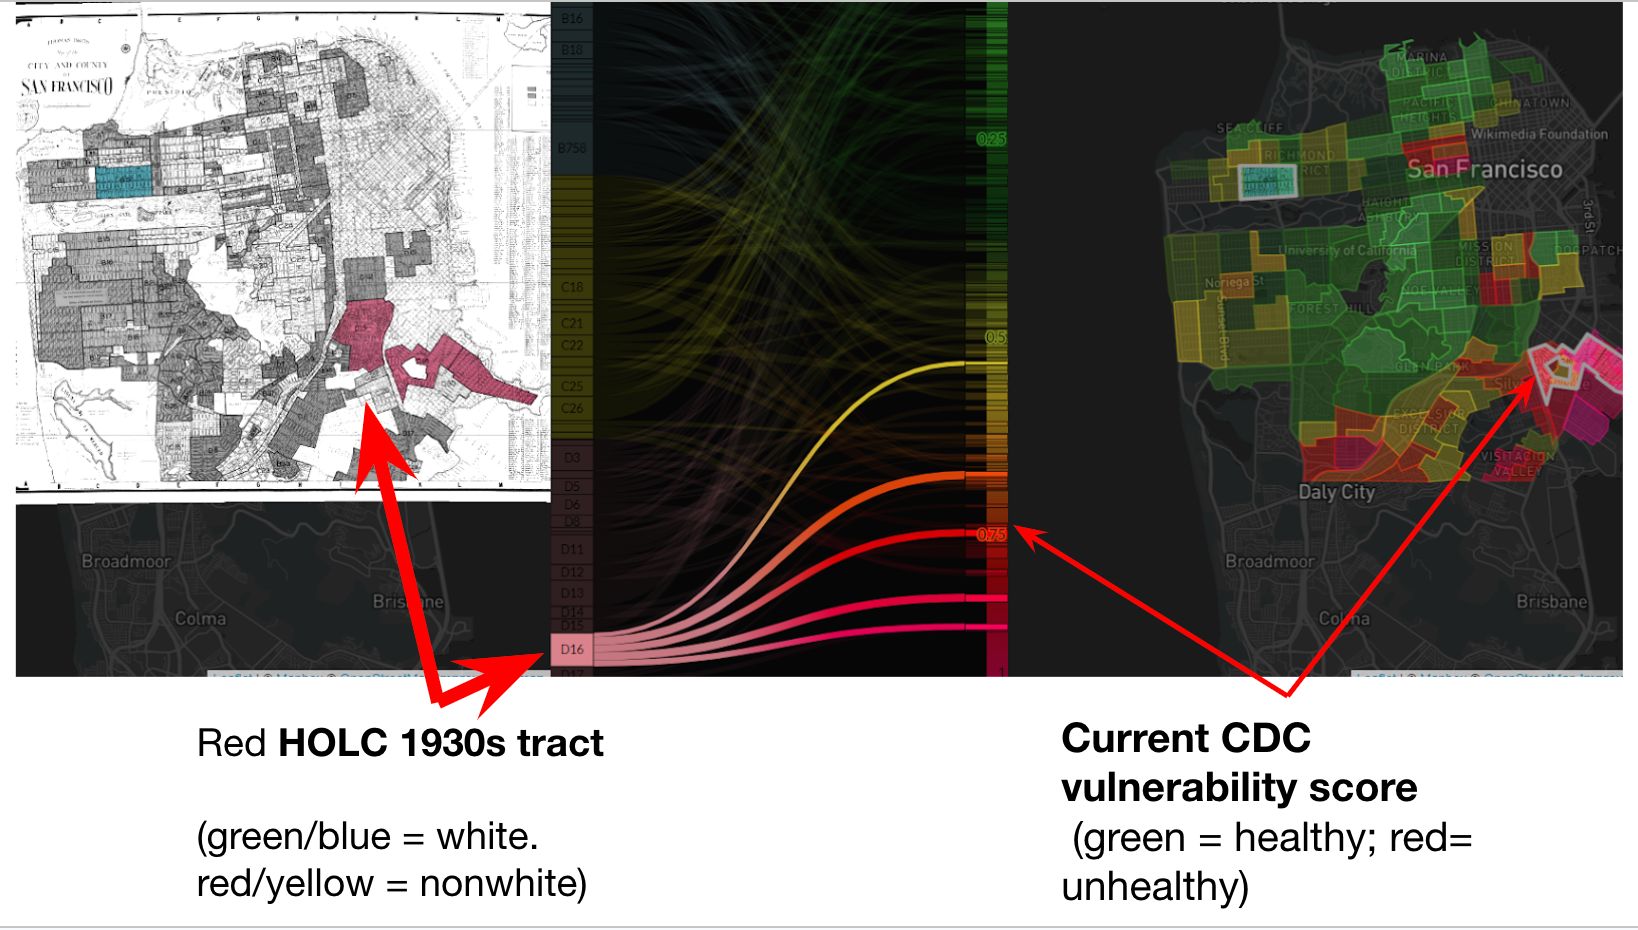
Gallery: examples of factors examined
STEP SIX: CREATE A NEW STRATEGY
Students choose from options below:
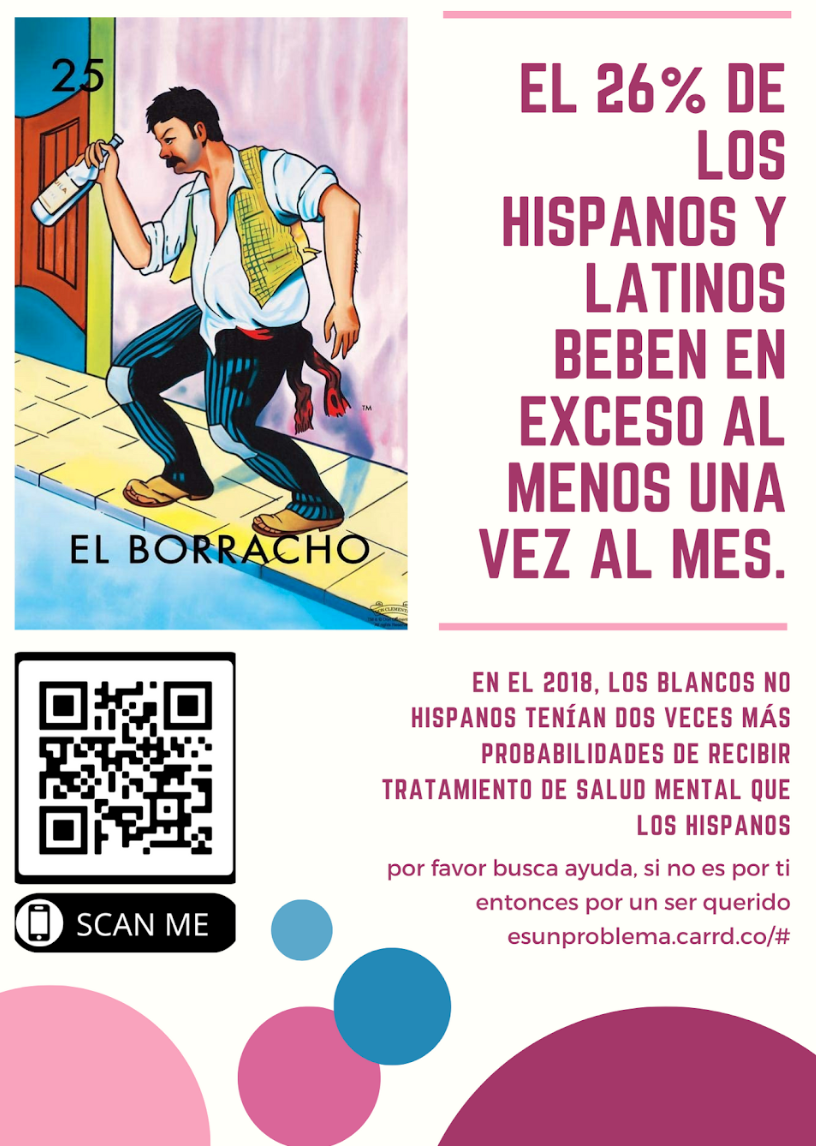
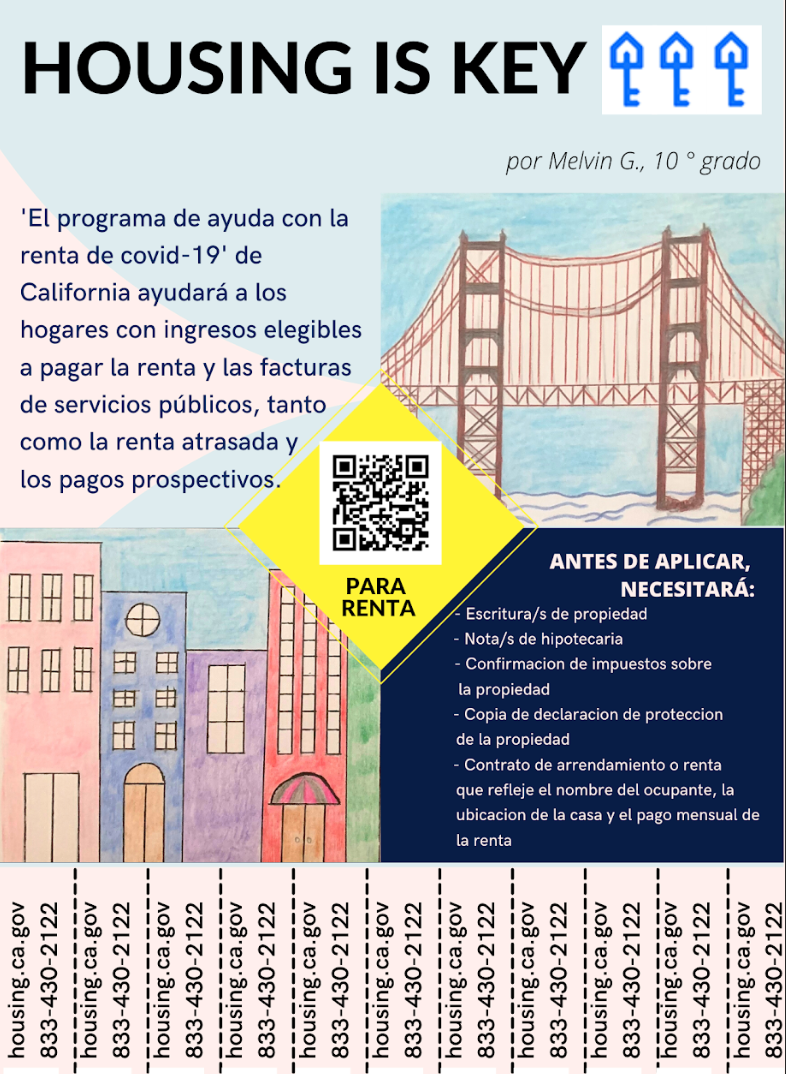
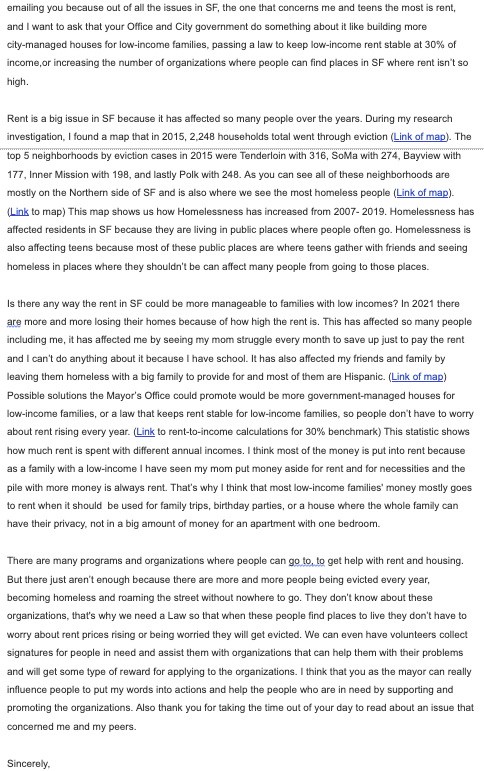
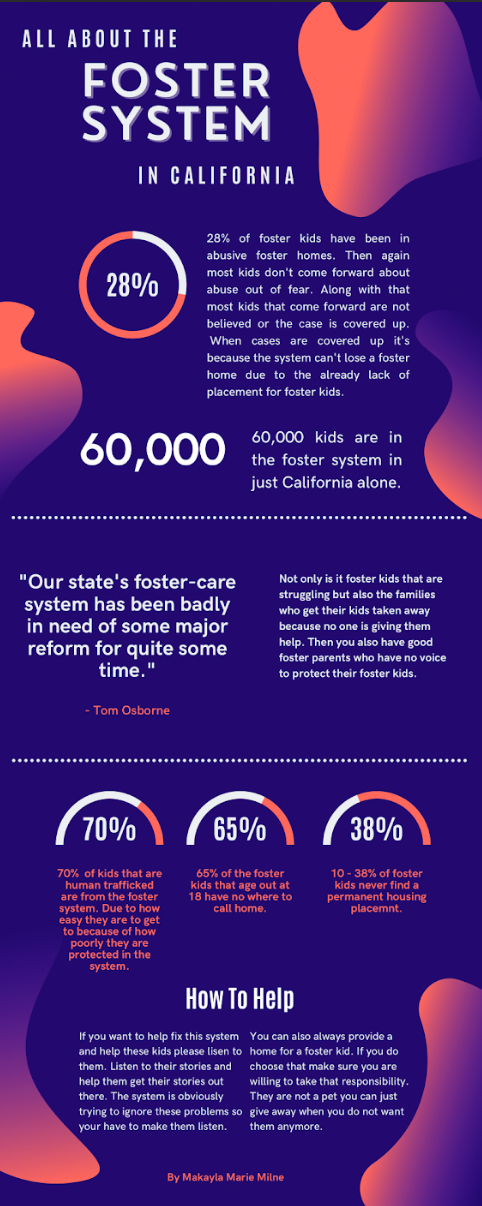
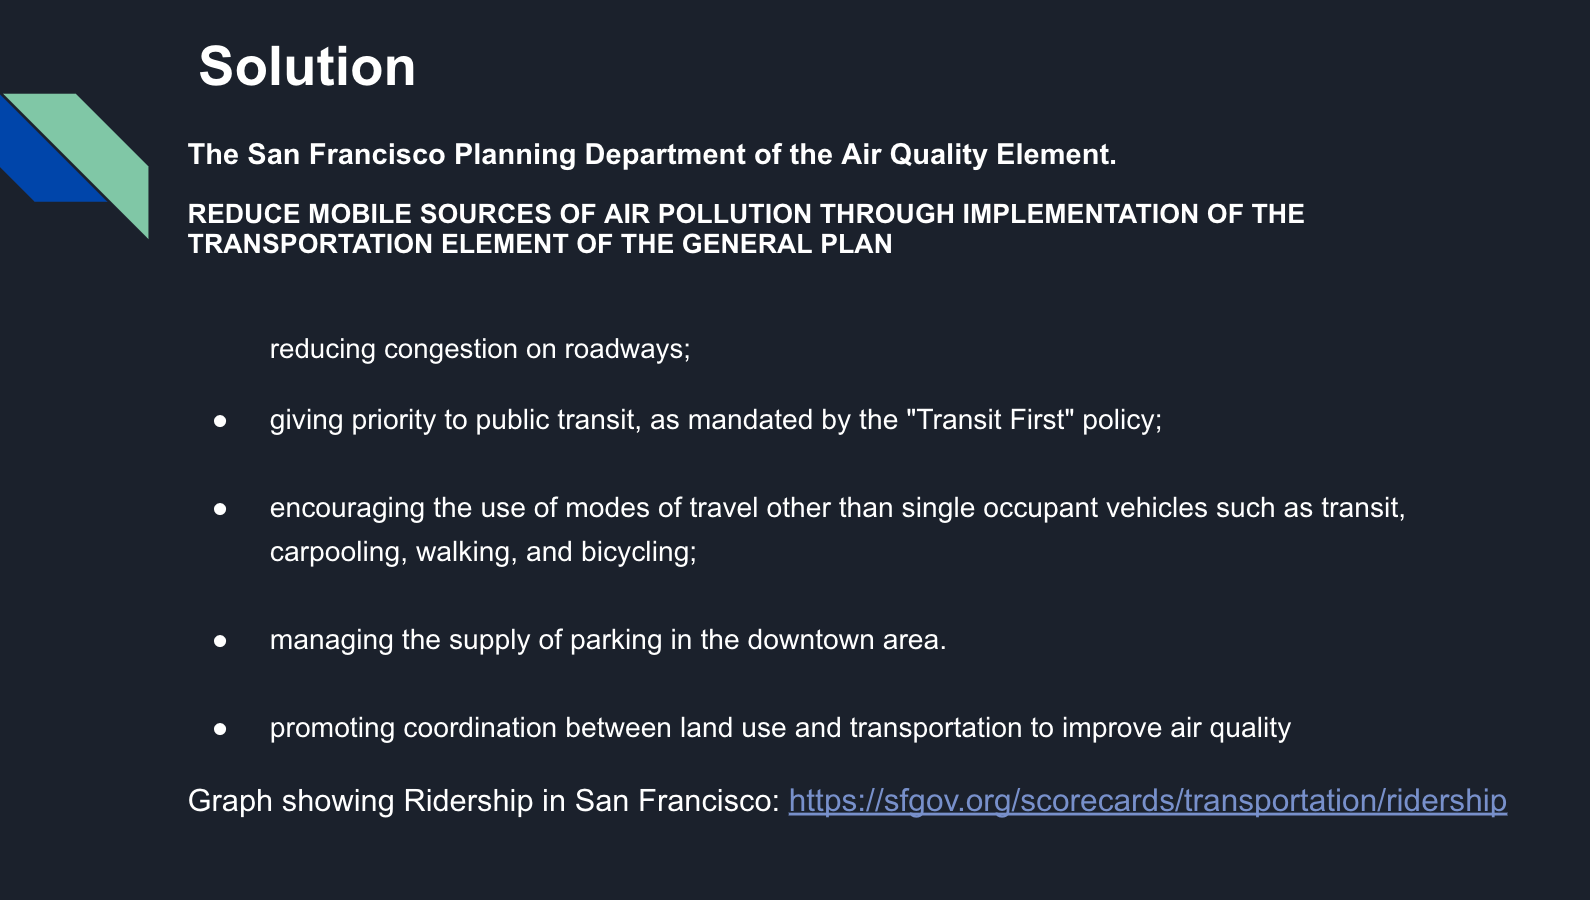
Examples of student projects
STEP SEVEN: SELF-EVALUATE
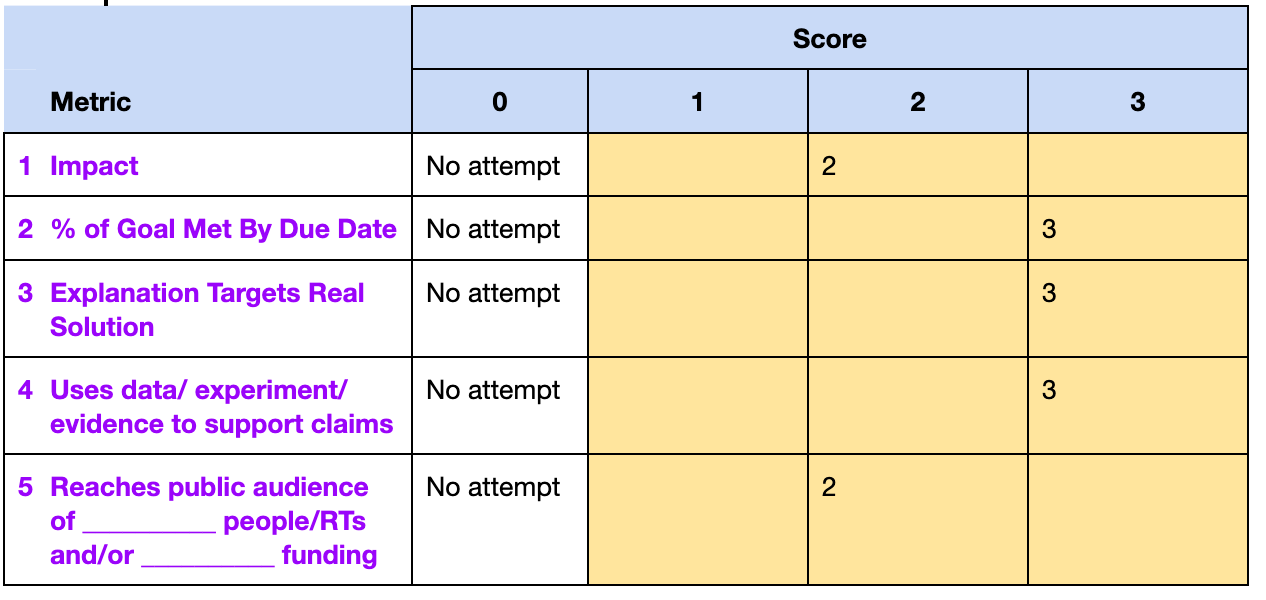
Students complete this rubric and grade themselves.
Afterword
The following year, I used it to help bridge interdependent relationships (kelp, their own neighborhoods where they've identified a/biotic factors, etc. and carrying capacity (Rapa Nui, Keeling Curve, covid curve).
I feel like I can do a lot more with this and I will continue to update the slides, embedded links, and more in-depth maps. Feel free to copy and use for your own needs.

