Data Science, Human Geography, & Environmental Justice Youth Project (DL compatible)

Data Science, Human Geography, & Environmental Justice Youth Project

Inspired by Undesign the Redline PBLs, Rebecca Solnit’s Infinite City, and the intersectionality my students navigated every day, I resolved to honor their distance learning investment by making the ecosystem and data analysis about their new pandemic-era environment. My students wanted to learn how to help, instead of remaining silent and isolated from what science was wrestling with in reality, both in terms of research and outreach. Learning human geography in the context of how to define life during the pandemic and how to design metrics for answering scientifically testable questions was one way they could figure out how to cope with daily catastrophe and grief.

STEP ONE: SURFACE EXISTING KNOWLEDGE & ESTABLISH COMMUNITY CONTEXT.

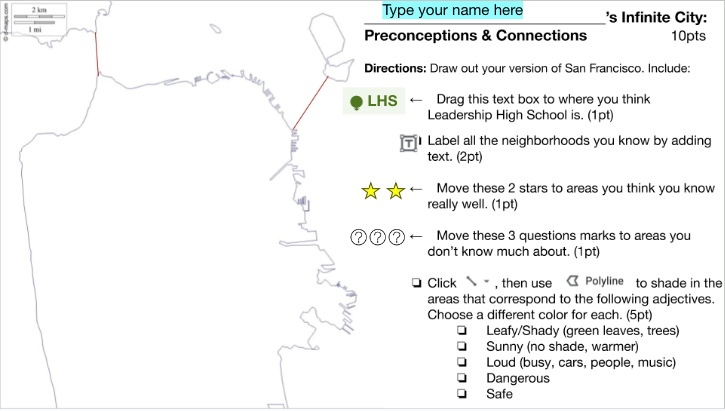
First I asked students to mark on a blank map of San Francisco where they lived (or where they were willing to report) in relation to the school. Students noticed certain patterns and created questions about it said about the students or the school.


STEP TWO: INVITE SHARING SOMATIC OBSERVATIONS TO IDENTIFY LAYERS OF PATTERNS.

We used a padlet to share the 5 senses we could describe in our own separate neighborhoods across the city, and used that to create a summary of the communities and the questions they presented.

Students developed their own sense of purpose and curiosity when their sense of intersectionality was acknowledged and made explicit through formalized data.

Some possible prompts:

  • What kinds of places do you go to relax or be at peace? Any green spaces? How far away are they?

  • What kinds of people live near you? How would they describe themselves?

  • How do the people around you make a living?

  • What products do you or people around you use? What brand names do you see most often?

  • What medical or health needs do you notice in people around you?

  • What sounds do you hear around you?

  • What smells do you sense?


STEP THREE: IDENTIFY ISSUES.

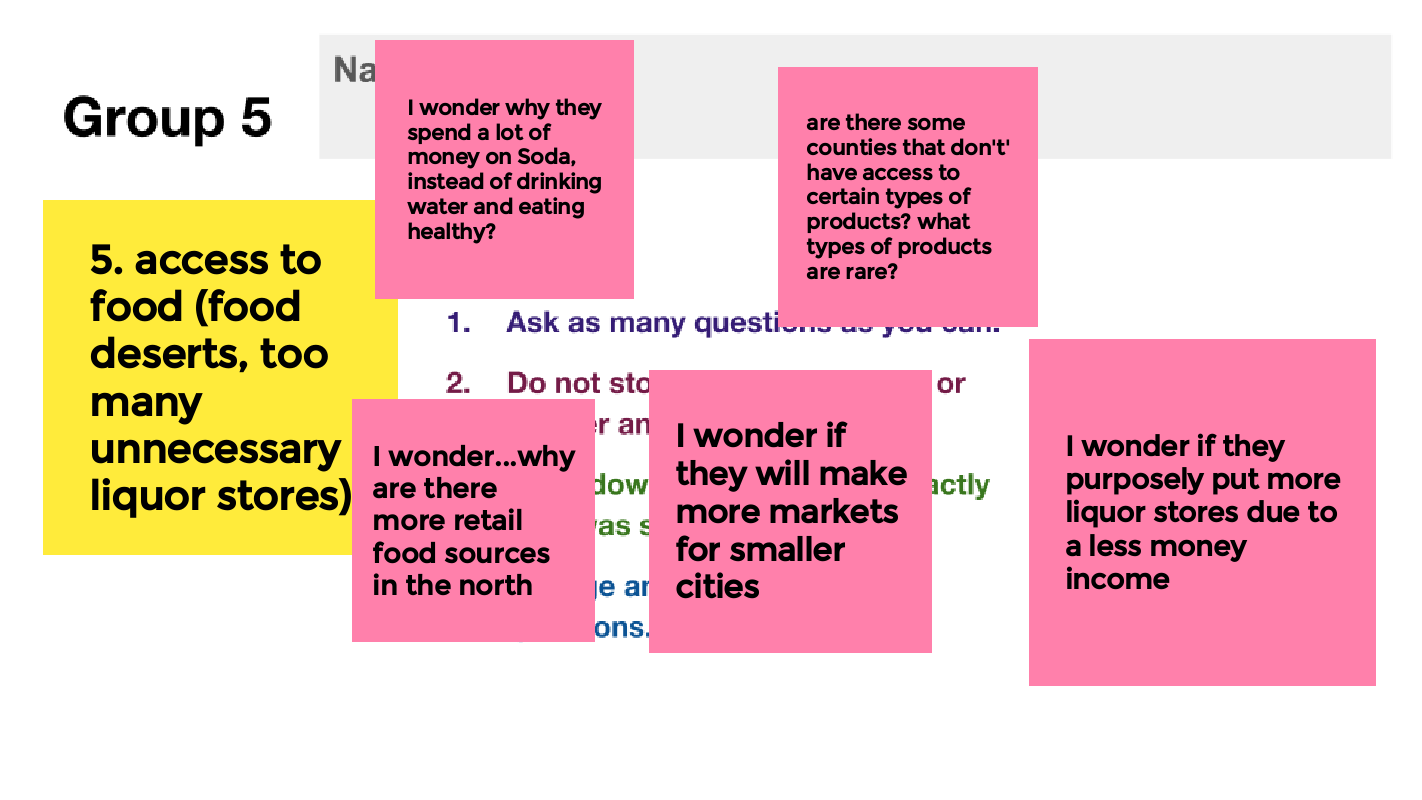
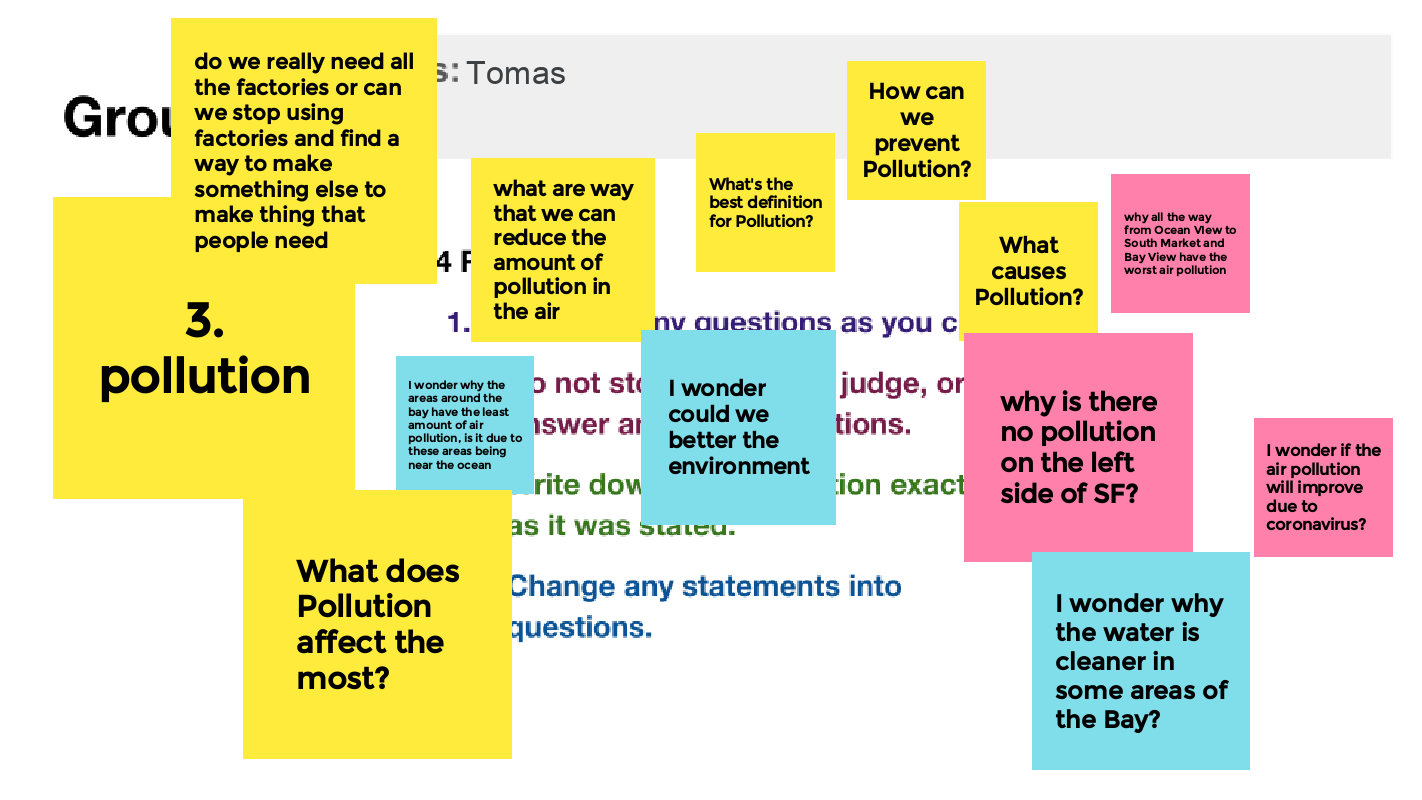
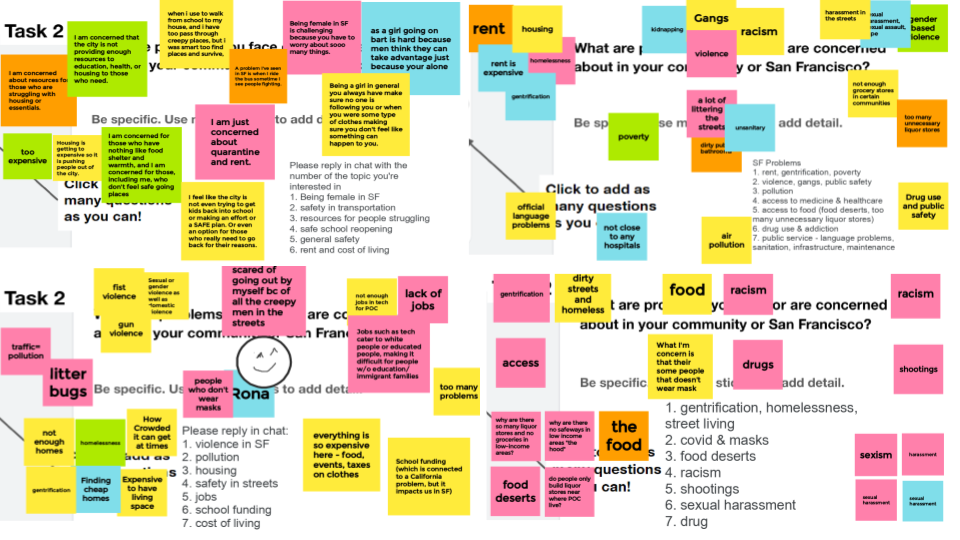
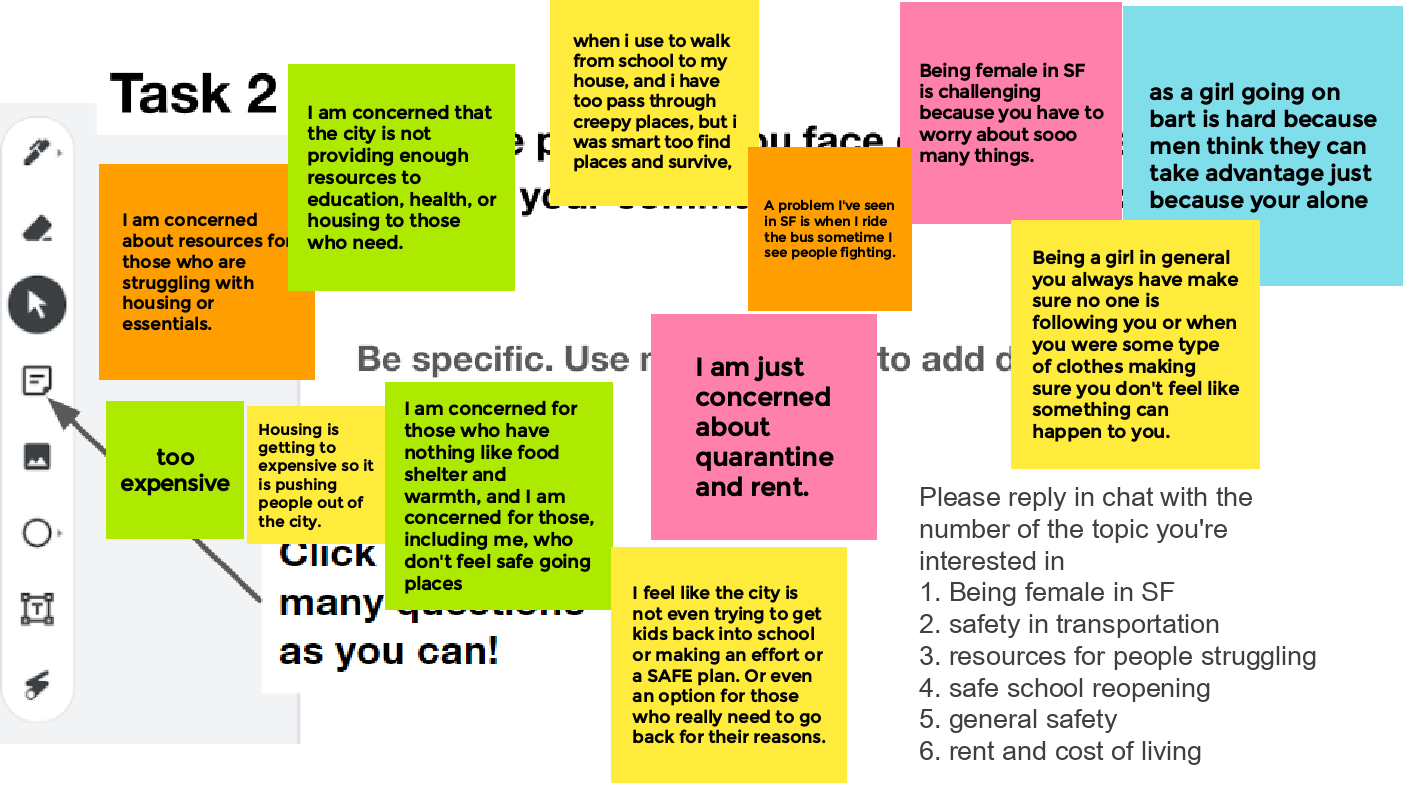
Approach: Question Formulation Technique based on recent headlines. Gathered a Jamboard of recent headlines based on patterns identified in Step 2 and asked students to add questions. Students then discussed further in another Jamboard to talk further about experiences in the city. During physical classroom learning, students used post-it notes and others added to a padlet.

Preview (distance-learning Jamboards)


STEP FOUR: EXPLORE AND ANALYZE DIFFERENT LAYERS AND TYPES OF DATA TO INFORM FOCUS.

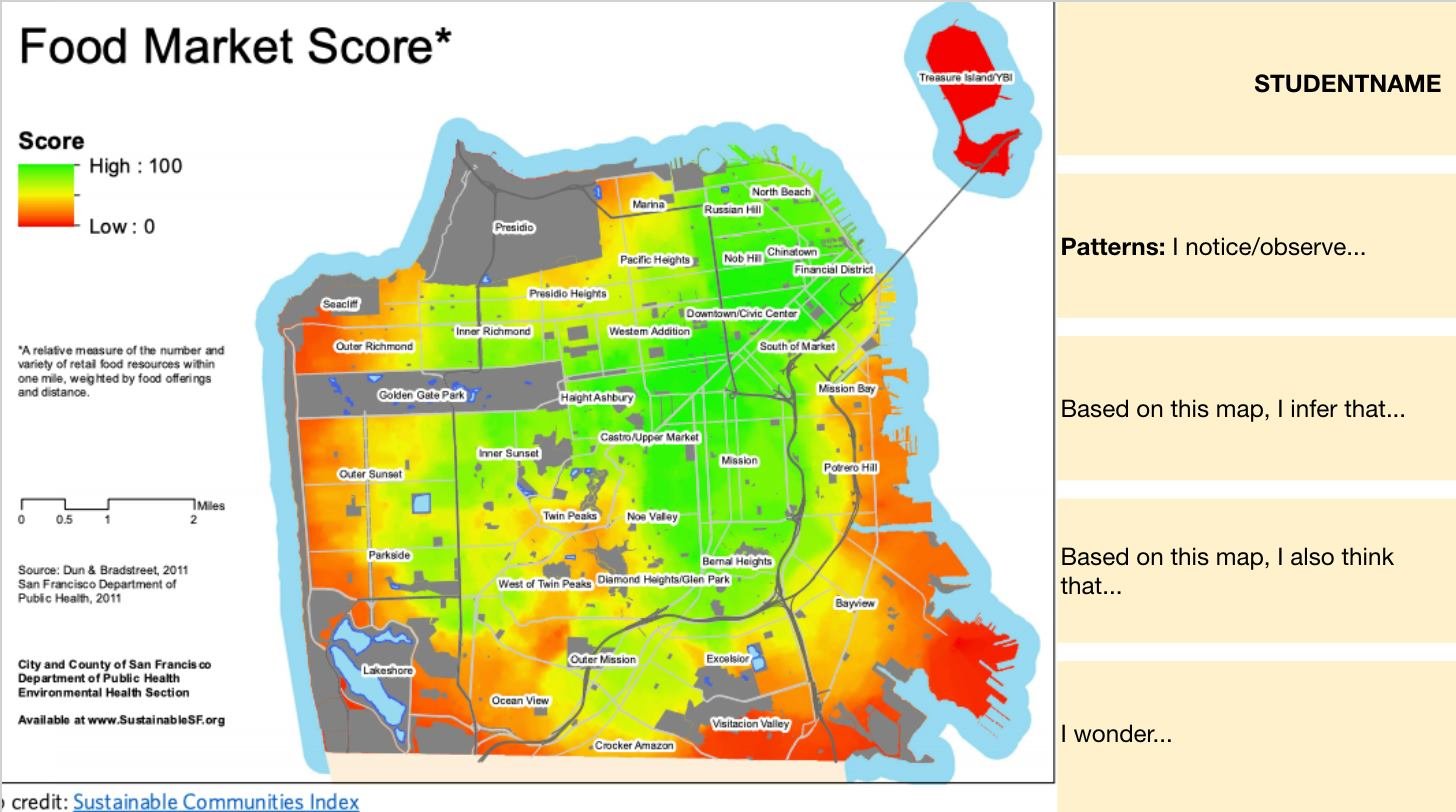
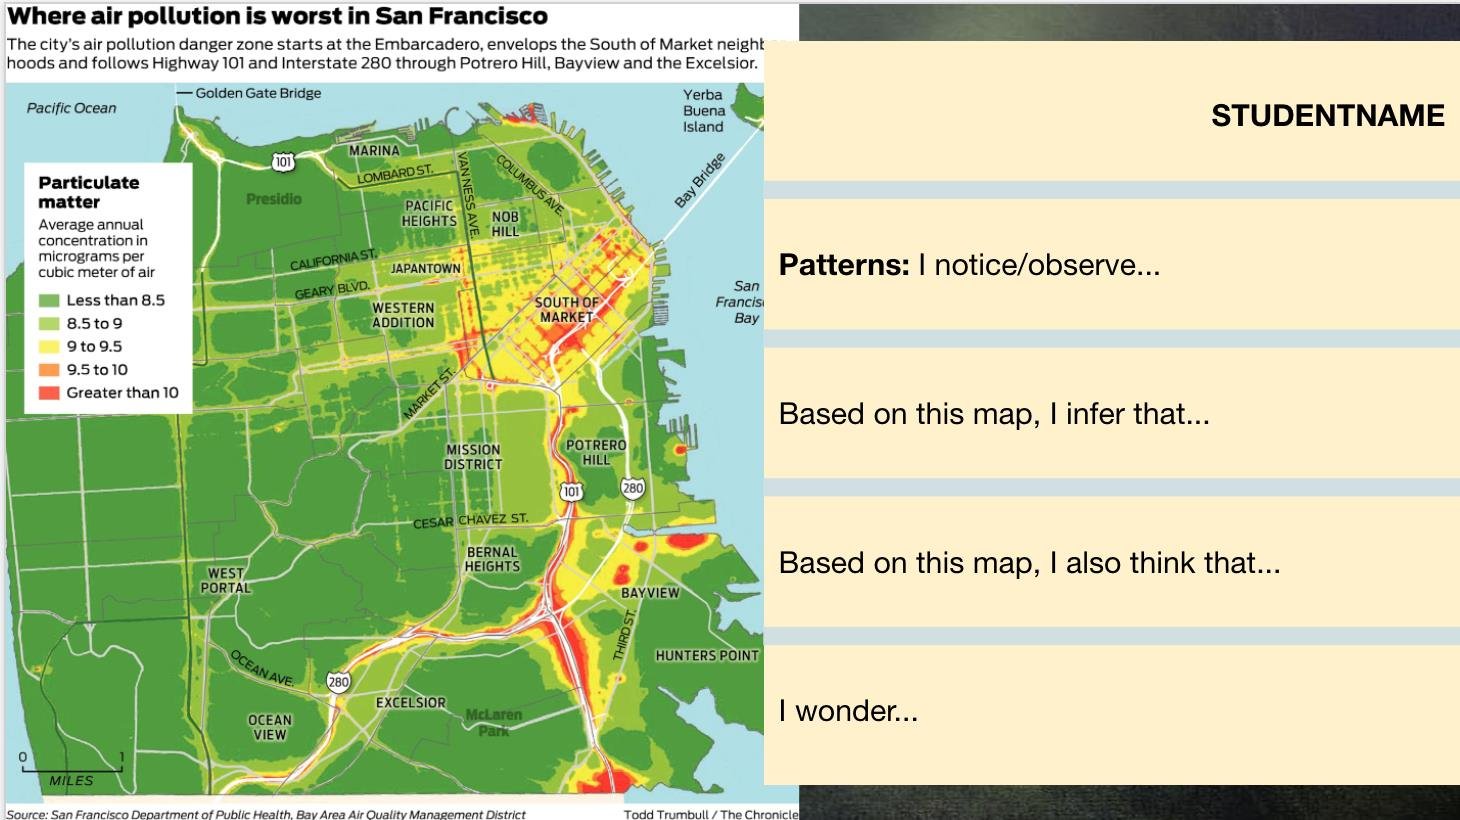
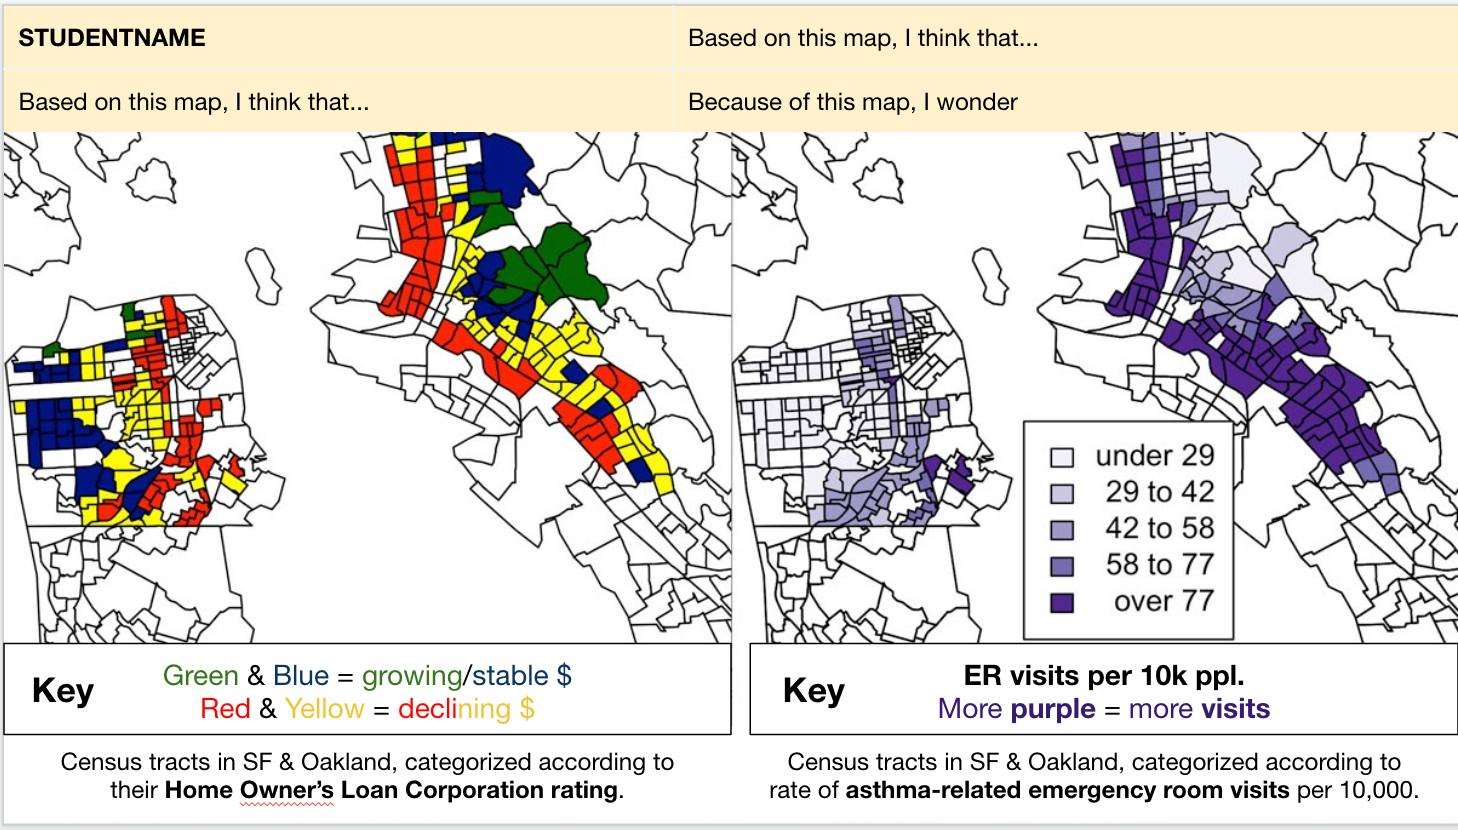
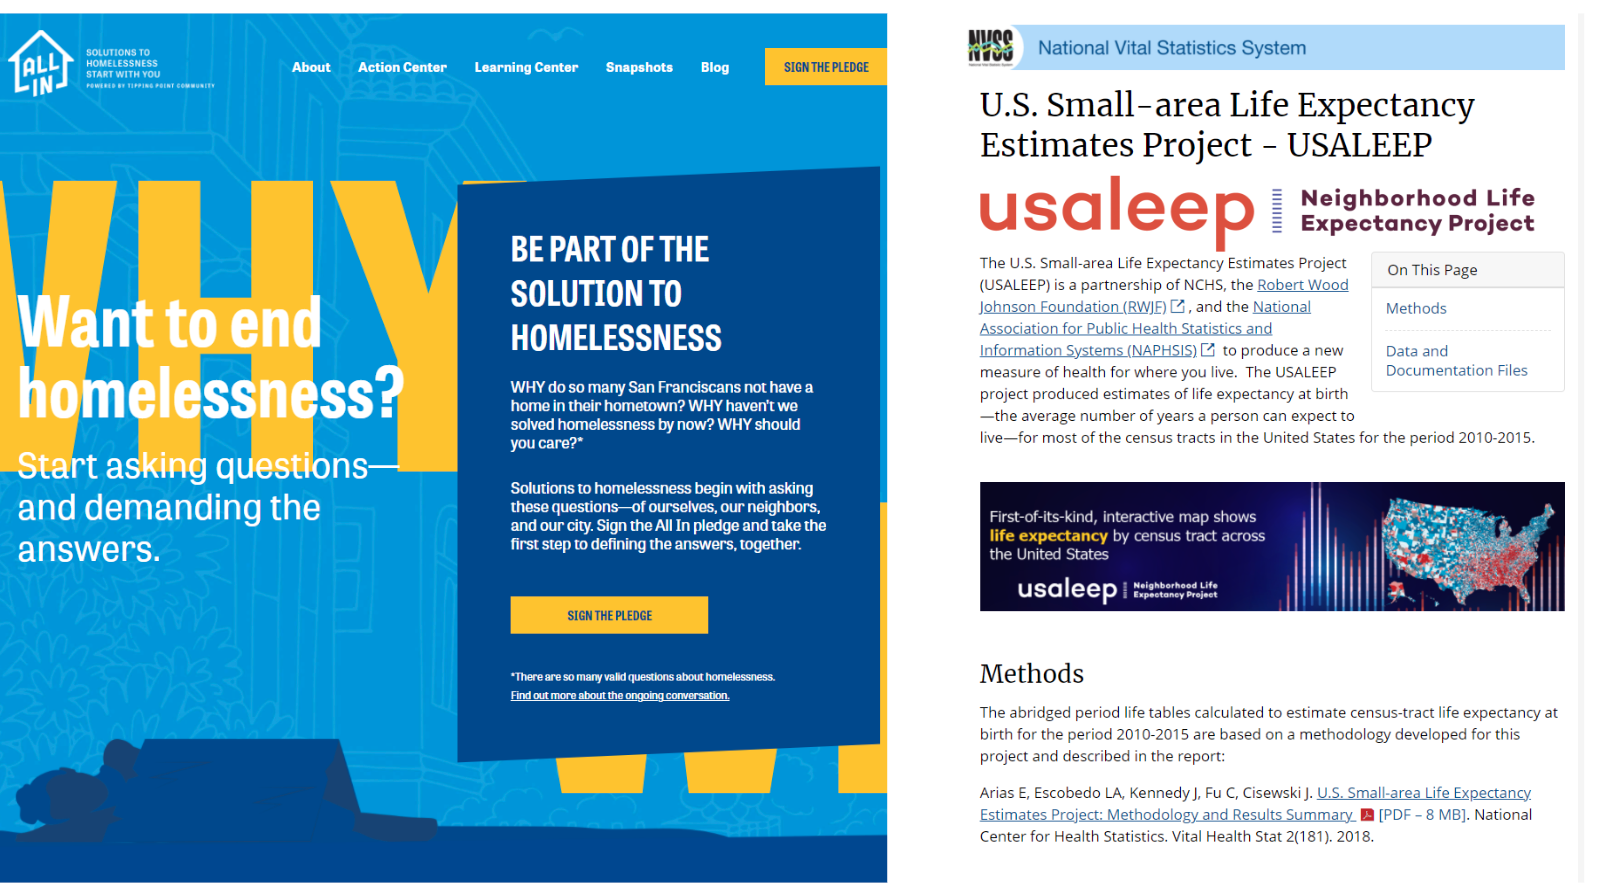
To further spark our ideas for identifying the issues our communities experienced, we then examined a slide deck I created of 30+ KWL slides of San Francisco maps (biological, historical, cultural, political).

Preview:


STEP FIVE: RESEARCH AND CRITIQUE A SPECIFIC STRATEGY

Template side for describing and evaluating the solution

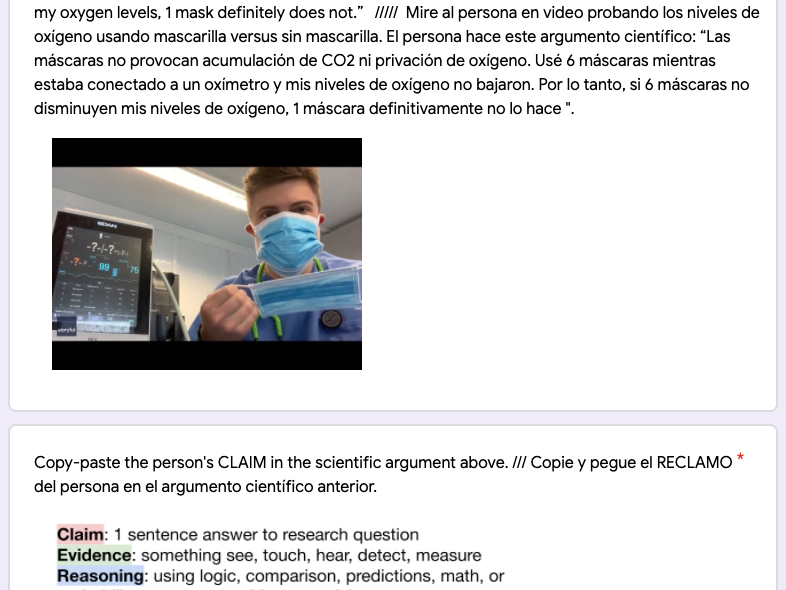
Are the strategies used by adults addressing the problems identified?

How does the data support your analysis?

Gallery: examples of factors examined


STEP SIX: CREATE A NEW STRATEGY

Students choose from options below:

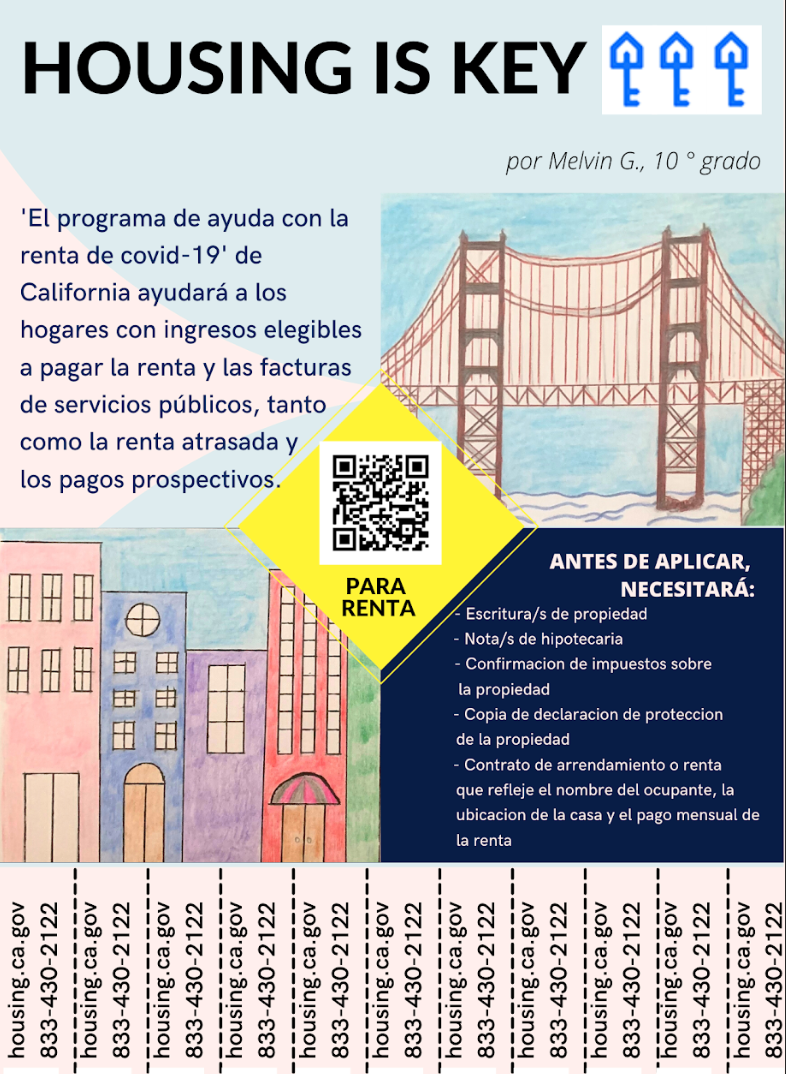
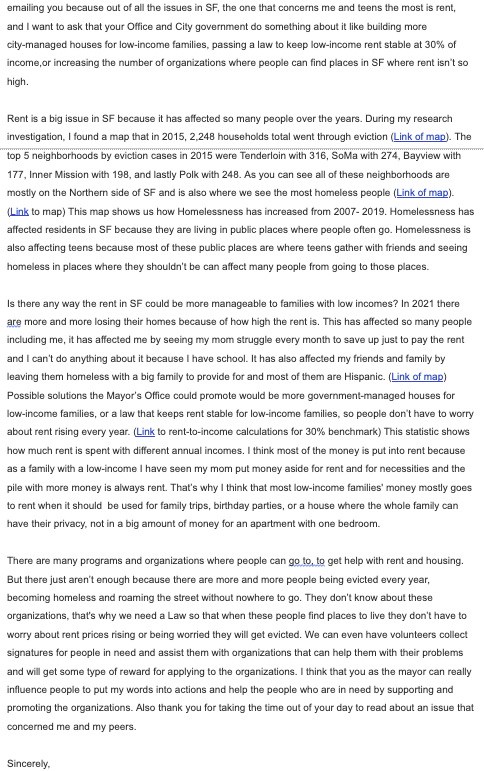
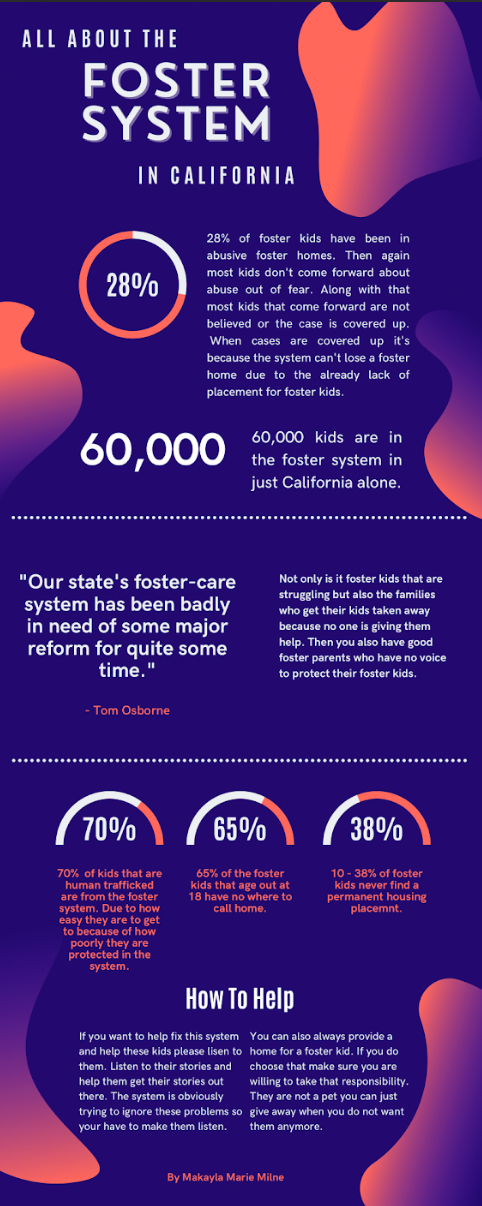
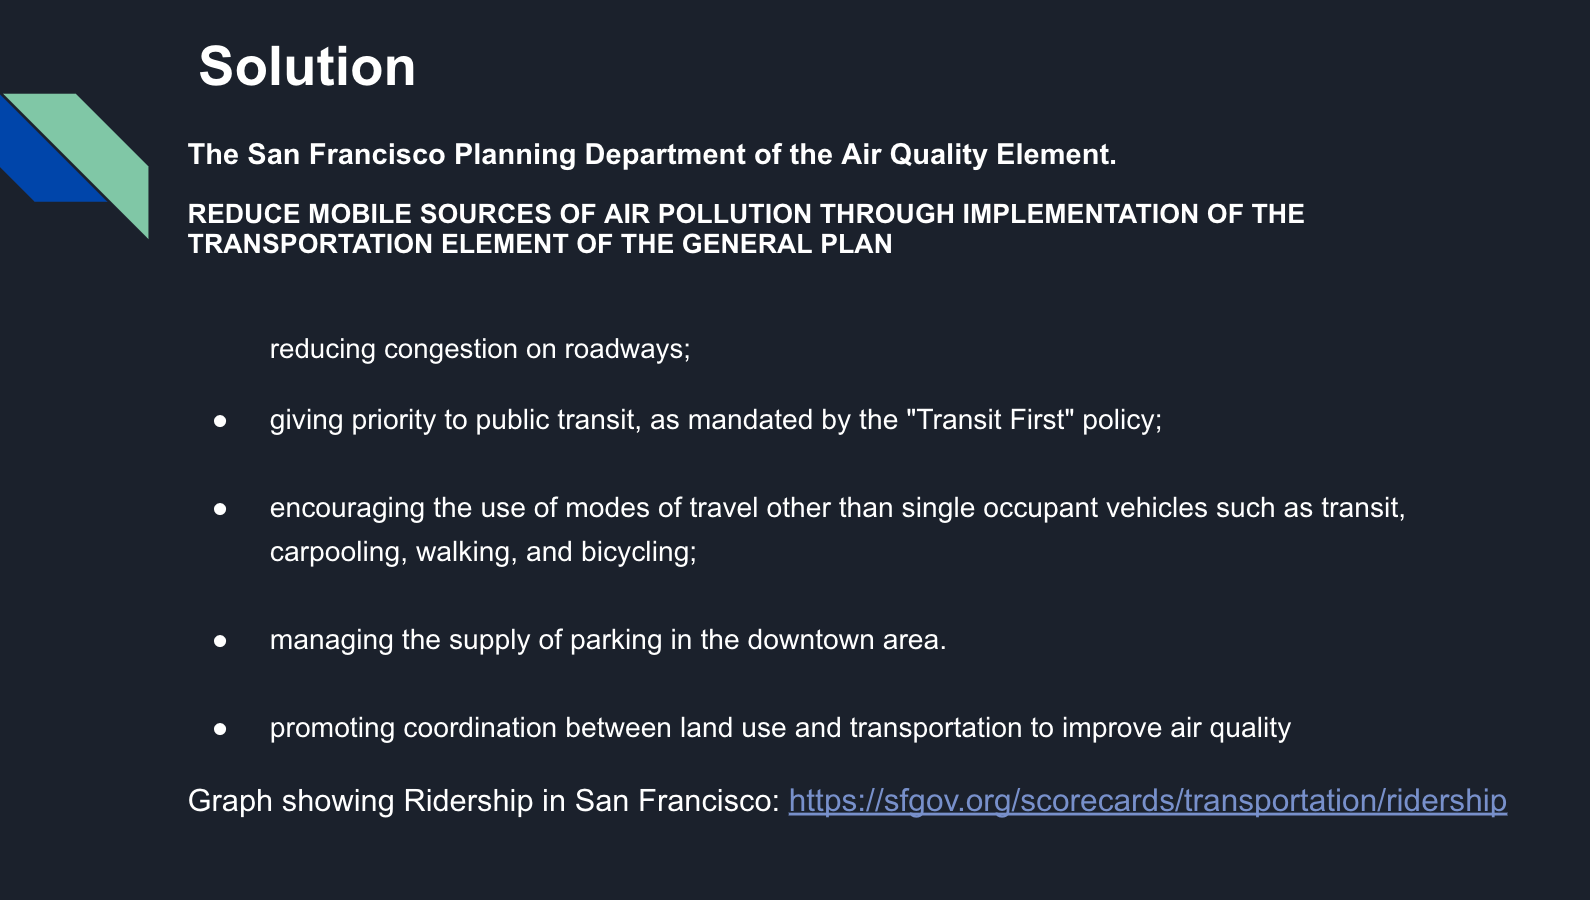
Examples of student projects

(Template for students choosing to use Slides)


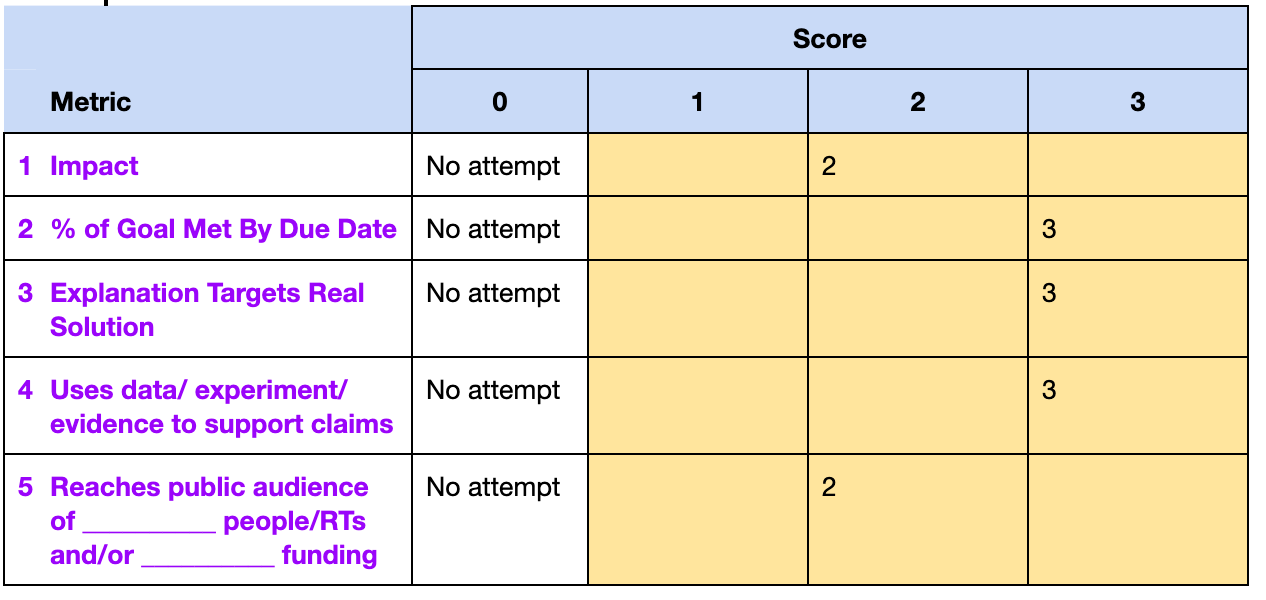
STEP SEVEN: SELF-EVALUATE

Students complete this rubric and grade themselves.


Afterword

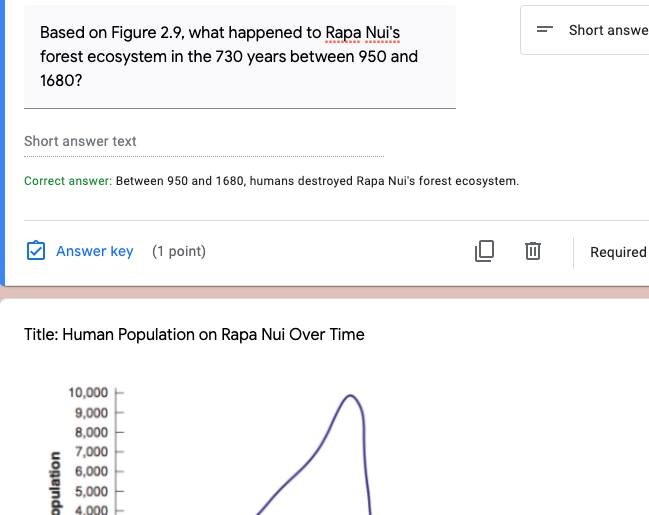
The following year, I used it to help bridge interdependent relationships (kelp, their own neighborhoods where they've identified a/biotic factors, etc. and carrying capacity (Rapa Nui, Keeling Curve, covid curve).

I feel like I can do a lot more with this and I will continue to update the slides, embedded links, and more in-depth maps. Feel free to copy and use for your own needs.

Quick and dirty write up: first day sound cups seating

sound cups for seating, opaque cups sealed with mystery contents that match

In reply to CK’s ask for how to make sound cups:

Make Prep (only once)

  1. I usually get junk i have in pairs, anything that can make a distinctive sound. “Variation is key to both problem-solving & survival.”

whiteboard with instructions

>>Examples: Feathers. Paper clips. Binder clips with and without the little silver bits. Rubber bands. Jingle bells from napkin rings. 2 Dice. 5 dice. 3 crumpled paper balls. 1 crumpled paper ball. 5 golf pencils. 1 golf pencil. (That’s already 22 cups.)

2. I put them in red solo cups and seal the end with anything opaque, even another cup. Rubber band or Velcro or tape the end so students can double-check.

3. For each pair of cups, I also sharpie half of a word, so I can check whether they are correct. This adds another “variable” they can “measure”.

>>example: “bio-” on one cup, “-logy” on the other. If students notice, I say this is one observation they can turn into a test of more variables that can help them find the right cup: checking the bottoms of cups.

During Class

I greet them at the door with the cups, check them by last name as they enter, and ask them to take one randomly and then try to find the matching cup. I model: “hi, my name is, my pronouns are, and this is my cup.”

Once students realize this is the first activity they get into it. Occasionally I will go through and mix them up the way a Canadian goose does, suggesting they compare sounds.

The goal is to get them talking, especially what they notice about the sound or other variables they can compare between a pair of cups. They get to sit down at a table I assign (“just for this week”) once both have shown me what detail convinced them the most that they matched. I try to ask them to explain what they mean at least once.

Can’t hear anything! When it gets loud I get to remind them to observe carefully and mind each other’s listening needs, just like we will do this year for other needs.) They will also devise their own ways of listening better or isolating sounds to compare. It’s a nice chaos that gets them going with a very simple data-test-check sequence.

Timing? Your mileage may vary. If it takes way longer than you want, you can cut it off and bring everyone back together and say “when we explore other planets, we won’t have a teacher or a way to check the cup. We can use each other’s observations to figure out where we can go and what to do next.”

Do you let them open it up to check? Depends on the message you want to reinforce about statistical certainty in science.

Then I do an intake form and explain how icebreakers are for habituating your body and startle response to these other people, not to memorize everyone’s details on the first day.

Students report this is helpful for calming first day anxiety, while still challenging their minds.

Google Form Quiz: Evidence/Inference

I made a form for reviewing evidence-inference, independent/dependent variables, and change in biotic factors on Rapa Nui.

All answers have explanatory feedback and/or youtube video explaining more. Feel free to copy/change/adapt/share as always.

Sources: Has some biology of stress on executive function stuff & how rituals lower cortisol, as well as YPAR institutional change scenarios. I think I put a reforestation link in there somewhere but I'm tired.

120225698_10112402136196441_4747692984969145686_n.jpg
120291428_10112402134120601_3778738219014299536_n.jpg
120439511_10112402135572691_2406791568366613502_n.jpg
120268897_10112402135887061_3243674183322218070_n.jpg

Google Form Quiz & Slides: Observe A/Biotic factors & evaluate CER of 2 mask-wearing-CO2 arguments

I made a Google Forms that asks Ss to:

  1. 1) identify a/biotic factors (shows video & asks students what they think of different models),

  2. interacting,

  3. in their neighborhood.

It then asks copypaste for a CER analysis of 2 covid-19 mask-CO2 arguments. The only ones with pts have Feedback that automatically responds with the correct answer.

(English & Spanish.)

Screen Shot 2020-09-20 at 10.29.59 AM.png

Lesson (2x): Forensic Entomology

What these files add:

  • abridged (optional) background readings w/ checks for understanding

  • editable Slides w/ enhanced, labeled, enlarged images of important evidence

  • re-orders agenda for more student discussion & asking questions

  • cards for scaffolding asking questions about evidence

  • videos for discussion

  • reflection exit ticket

Task: Using climatological data, forensic insect evidence collected from deceased human, experimental entomology data, and research on blow fly life cycles, estimate the time of death for a homicide victim.

General question: If entomologists study insects, how does their research help us estimate time of death?

Major concepts: Science as inquiry & modeling, evidence & inference, all organisms must be able to obtain and use resources, grow, reproduce, and maintain stable internal conditions, energy as heat.

Real historical events: This uses a real homicide case from 1986 and incorporates scans of the forensic examiner’s notebook, the news articles, letters among investigators, experiments performed by the entomologist, and photographs of the insects collected.


Agendas

I. Blow Fly Life Cycle & Accumulated Degree Hours

1. Introduction

a) Do Now - murder trial

b) Turn & Talk: Sample of ____? collected from body as evidence (good opportunity for realia)

c) Request from State of Connecticut

2. The Life Cycle of a Blow Fly

a) Document: Forensic Examiner’s Report

b) Worksheet: Blow Fly Life Cycle

3. How Weather Affects Blow Fly Life Cycle

a) Document: Preliminary Climatological Report

b) Worksheet: Accumulated Degree Hours & weather data

II. Experimental Design for Time of Death

4. Designing an Entomology Experiment to Solve a Problem

a) Card Sort & Reveal: Asking the Right Questions

optional: Rear flies on raw liver!

b) Document: Entomology Case Experiments

c) Discussion & Worksheet: Entomology Case

5. Videos About Forensic Examination

a) Career: A Day in the Life of a Forensic Pathologist

b) Career: Forensic Examiner without the Mess…Camila the Cryptanalyst

6. Exit Ticket: Reflection on Media Coverage


Setup Decisions: “Asking the Right Questions Activity”

Decision 1:

Option a) Print double-sided.

Option b) Print single-sided and staple on top of each other.

Decision 2:

Option a) Ss flip over all the cards and make a conclusion together.

Option b) Ss flip over a few cards at a time and revise their explanation.

Option c) Ss flip over only X number of cards, chosen by group agreement, and make conclusions based on the answers. Compare class answers.

Sources

  • NIH, Visible Proofs: exhibition of the history of forensic anthropology (answer keys on website & on file by request)

  • William Krinsky, Yale University School of Medicine

  • Henry Lee, Connecticut State Police Forensic Laboratory

Data FRQ Posters: Should we arm teachers?

Features

  • 8 graphs

    Coming Soon: example posters by students

    Context: Whenever a school-wide walkout happens where teachers stay in the classrooms, I present a data FRQ about the theme of the walkout. The poster becomes extra credit for students who complete and present it. Choose your own minimum of graphs used.

Inferring From Evidence: Data Over Time

Features

  • Time: 5 min share — 15 minute discussion

  • Response sheets (2 per page)

  • Large print pages of the graphs

  • Challenge question: what’s another way we could interpret this? can we trust the evidence here? what other effects could these phenomena have?

Sources

  • (see doc)

  • more coming soon


Lesson: Opportunity Cost

Time: 60 minutes

Goals:

  • Identify the opportunity cost of a decision.

  • Apply the concepts of scarcity, trade-offs, and opportunity cost to a decision by a hypothetical high school student (Franklin) who had to choose how to use his after-school time among three alternatives.

  • Explain the rationale for the recommended decision.

Additional prep required: Task card from Activity 3 in (PDF)

Includes

  • Video: explanation, timer

  • Do now

  • Group instructions

  • recommendations to an imaginary high schooler)

Agenda

  1. Do Now

  2. Video: What is Opportunity Cost?

  3. Opportunity Cost…in Minecraft? (or village settlement if students are unfamiliar with survival sandbox games)

  4. Franklin’s Decision

Assessments

Written explanations of recommendation based on persuasive writing.

Recommended Extension: Applying A Decision-Making Model: You & Your Future (PDF)

Sources

  • Focus: Economics of Personal Decision Making – Activity 3: Franklin’s Decision (PDF) (National Council for Economic Education)


Lesson (2x): Claim-Evidence-Reasoning

Distance Learning Agenda:

  1. Pre-Assess in Forms w/ video, what is evidence, what evidence is valid in Dad-Is-Alien argument

  2. Breakout Room card sort of evidence from Mars Opportunity rover, 1 shared Doc https://docs.google.com/presentation/d/1Fa85BSs970inCMMQ6HdmS_SWtBx91Fx5-fFXW96y_Wc/edit?usp=sharing

  3. Review Jay-Z CER & Formative (haha) assess 3 Ignoble CERs: https://forms.gle/mf4sv5WWsorQRq5u8

  4. Revise Mars after gallery walk

  5. CER breakout pairs for practice argumentation, scribing on 1 shared Doc https://docs.google.com/document/d/1VmlYn5Z7ND2tYSr3e-uSyGi59dbtl_j8-95j5csCpWw/edit?usp=sharing

  6. Gallery Walk, leave comments, freeze doc & assign individual re-write

  7. Card sort mouse experiment variables 8. Learn how to write a testable question & design first experiment

Access Breakout Room Shared Slides card sort for this activity here.

Access CER argumentation pairs here .

I made an evidence-inference card sort based on evidence the Opportunity rover photographed on Mars. I assign each breakout room to a slide, students work together to sort ir/relevant evidence for the claim. I include the slide here. The sorting is the background image and the cards are actual images, so there's no typing or accidentally rewording things. Template slide at end for your edits.

Some guidance: Duplicate Slide 1 as many times as you have breakout rooms. Set Permission to Edit.

Option: Save completed slide as JPEG and email or submit as Form to instructor. Some framing: I follow up with a Do After that asks them to identify claim, evidence, and reasoning in several paragraphs. They also have a series of evidence-inference polls where we discuss the reasoning behind each answer.


Time: 55 minutes + 70 minutes

Goals:

  • Identify the claim, evidence, and reasoning in a scientific explanation.

  • Identify relevant evidence to support a scientific explanation, using real NASA photos from Mars.

Additional Prep Required: download external materials from here

Agenda (Pt 1, 55min)

  1. Do Now

  2. Video: Dad is an alien!

  3. Slides: Explaining Science - CER

  4. CER: Penny

  5. Solo: Analyze

  6. Pairs: Peer Review

Assessments

Formative (CER: Analyze; Mars check-ins); Summative: Mars Spoken Explanation

Agenda (Pt 2, 70min)

  1. Do Now

  2. Video: Are cats liquid or solid?

  3. Slides: Claim - Evidence - Reasoning

  4. Activity: Identifying Relevant Evidence…on Mars!

  5. Pairs: Peer Review

Sources

Learning Design Group, Reteaching Loop: Understanding the Role of Relevant Evidence in Supporting a Claim


copyleft notice:

You are free to copy and adapt all the teaching resources on this page. I appreciate feedback on what to keep/toss/expand/scaffold.

Activities: 4 Favorite Non-Verbal Community Builders

INGREDIENTS

RECIPE


1. 20+ identical, lightweight disposable cups (
e.g. SOLO, Dixie brands)

2. Rubber Band

3. String (2ft long/pc)

Tie 4 to 5 strings to 1 rubber band. Do this for each group.

  1. Instructor stacks cups into a random setup (e.g. pyramid, etc.)

  2. Each group member takes a string. Without talking, the group must use the rubber band to arrange their own stash of cups into the instructor’s setup.

  3. Increase complexity and repeat.

    Too easy? Have only one group member see the target stack. Set a timer.

    Reflect: How did talking affect your other abilities? Were you still able to accomplish the task? What helped you build the tower?


Full resource document with lesson background and cutouts here.

An excerpt from the document, which contains many variations for different age groups, etc:

Rules

1. This exercise must be played in complete silence. No talking.

2. You may not point or signal to other players with your hands in any way.

3. Each player must put together their own circle. No one else may show a player how to do it or do it for them.

4. This is an exercise in giving. You may not take a piece from another player, but you may give your pieces, one at a time, to any other members of your group, and other group members may give pieces to you. You may not place a piece in another person's puzzle; players must complete only their own puzzles. Instead, hand the piece to the other player, or place it beside the other pieces in front of them.

[Instructions]

Now you may take the pieces out of your envelope and place them in front of you, colored side up. This is a group task, and you will have 10 minutes to make your circles.

Remember, the task is not finished until each of you at your table has a completed circle in front of you. When all of you have finished, raise your hands.

Reflect: What was most challenging? What was easiest? What did you like the most about this activity? What did you like the least about this activity? What messages do you think this activity might be trying to say about working in groups?

GoogleDoc of Do Now, Instructions, & Exit Tickets, and photos of game pieces coming soon.


Writing Checks: Building Narratives From Evidence

Full resource page with lesson background here

GoogleDoc of lesson for my classroom coming soon.


GoogleDoc adaptation of it for my classroom setup coming soon


copyleft notice: You are free to copy and adapt all the teaching resources on this page.
I appreciate feedback on what to keep/toss/expand/scaffold.

Lesson: Intro to Cognitive Bias

Time 50-60 minutes

Goal Identify and explain different types of cognitive bias

Agenda

  1. Do Now

  2. Video: Why do human brains love fake news?

  3. Recognizing types of bias

    1. Notes (graphic organizer included)

    2. Review Quiz

  4. Poster: Examples & Prevention

  5. Exit Ticket

Assessments

  1. Formative

    1. Do Now

    2. Graphic organizer

    3. Exit Ticket

  2. Summative

  3. Poster (group)

Sources

coming soon

Inferring from Evidence: Correlation v. Causation


Features

  • Time: 5 min review — 15 minute discussion

  • 4 graphs, 3 questions per graph: identifies x-, y-axis & increase/decrease

  • Response sheets (6 per page), graphs (2 per page)

  • Challenge question: what else? why? how do we know?

Source